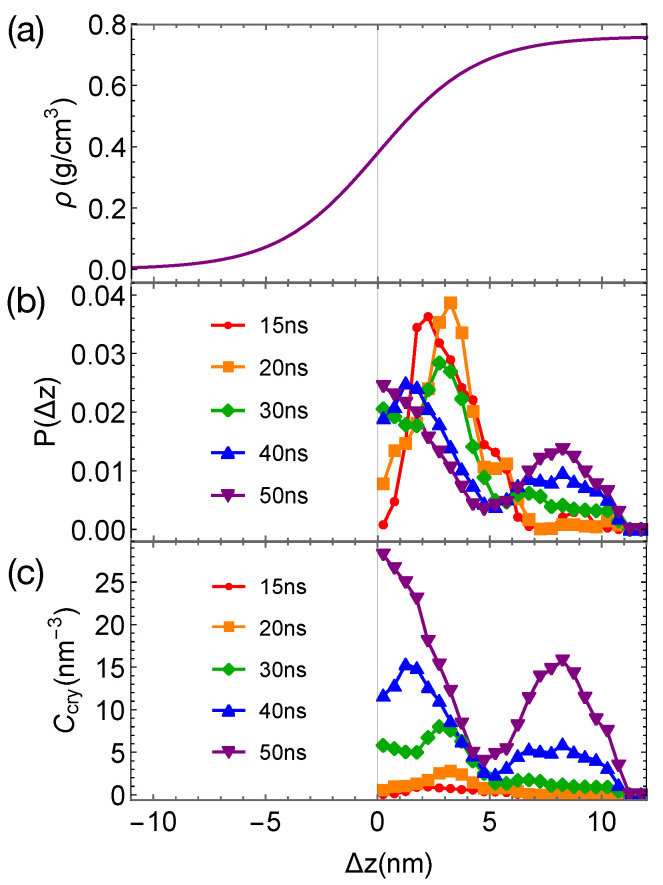
Figure 10.
(a) Hyperbolic density profile of PE by fitting data in Figure 9a; (b) probability distribution of crystalline atoms vs. distance from the closest planar interfaces at different simulation time; (c) concentration of crystalline atoms vs. at different simulation times. Data in (b,c) are averaged over eight trajectories.

