
Figure 3.
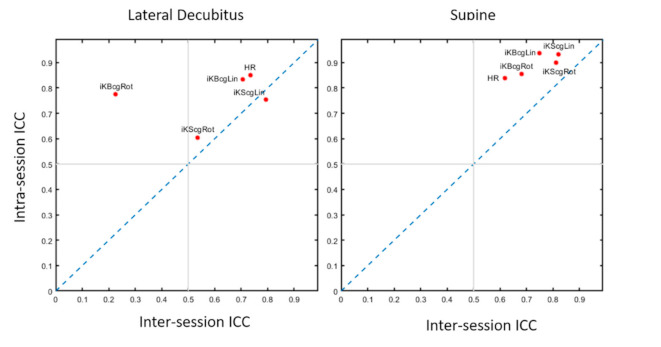
This scatter plot depicts the modal values appearing in both intersession (x-axis) and intrasession (y-axis) for each KCG iK parameter and HR. Two thin black lines are drawn to display the critical value ( = 0.5) for both intra- and intersession test–retest reliability, and the blue dash line characterizes the positions with equal intra- and intersession reliability.