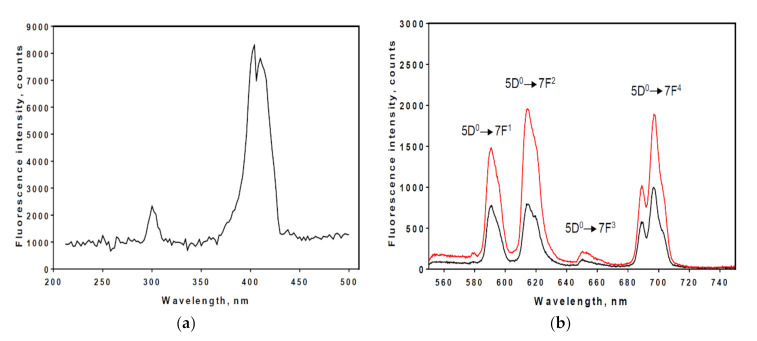
Figure 3.
Excitation and emission spectra of Eu3+ complex. (a), peak excitation wavelengths for Eu3+ complex were measured and using λem = 615 nm; (b), peak emission wavelengths for Eu3+ complexes were measured for free Eu3+ (black line peaks) and Eu3+ chelated by PMDA modified anti-human myoglobin Affimer complex (red line peaks). The electronic transition corresponding to the emission peaks are indicated. λex = 395 nm.

