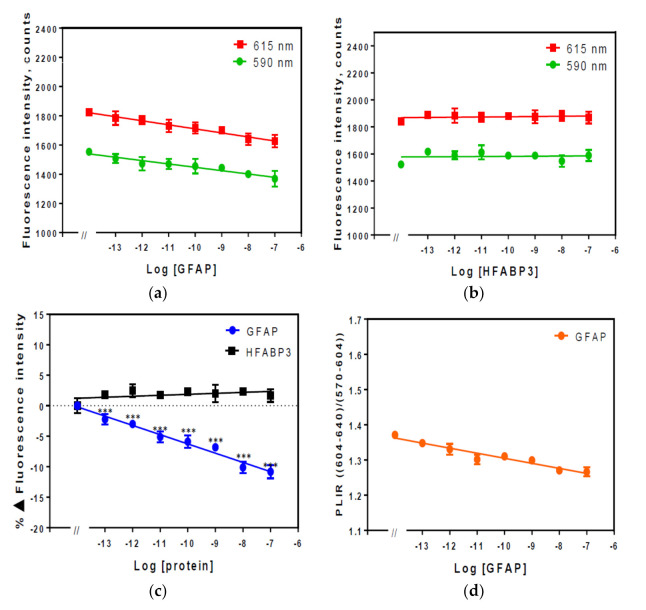
Figure 4.
Fluorescence intensity spectra of Eu3+ chelated by PMDA modified anti-GFAP Affimer complex in 1% (v/v) serum. Fluorescence was measured at 590 and 615 nm with λex = 395 nm. (a) Fluorescence intensity spectra of Eu3+ chelated PMDA modified anti-GFAP Affimer; (b) fluorescence intensity spectra of the same complex after HFABP3 added; (c), percentage change in fluorescence intensity; (d) photoluminescence intensity ratio. Data are means ± SEM (n = 4). Some error bars are smaller than data points (*, ** and *** indicate significance with p-value < 0.05, 0.01, and 0.001 respectively of the specific analyte (GFAP) compared to the control (HFAPB3) data).

