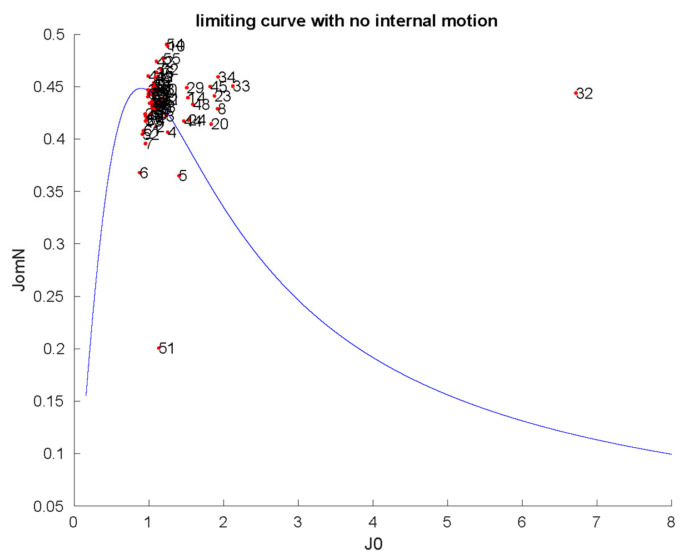
Figure 4.
Reduced spectral density mapping of NH mobilities in PAFC (298 K). The limiting continuous curve represents the absence of internal motion, as calculated by τc = 3.14 ns global correlation time. Spectral densities (the strength of fluctuating radiofrequency fields from molecular rotational diffusion) at 15N frequency shown as a function of such fields close to zero frequency (slow-motion regime) [40]. JomN on the vertical axis shows the spectral densities at 15N frequency, while J0 on the horizontal axis is proportional to spectral densities close to zero frequency. The units of the two axes should be understood as 10−9 (s rad−1).

