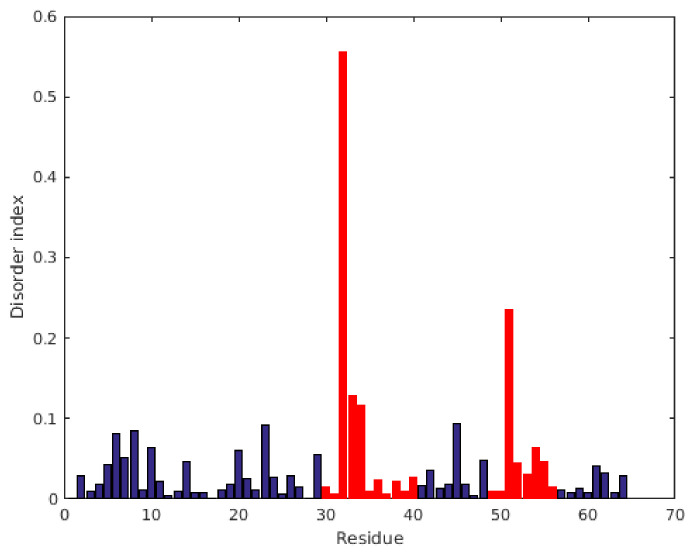
Figure 5.
Disorder index (DI), as obtained directly from reduced spectral density mapping of 15N NMR relaxation data. The DI is just derived from Figure 4 by calculating the geometrical (shortest) distances of the points from the solid (limiting) curve. The γ-core regions are labeled as red bars, while other residues are blue.

