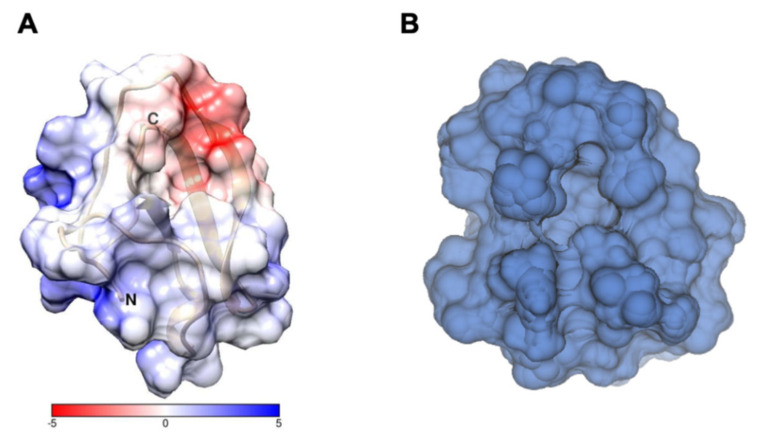
Figure 10.
(A) Electrostatic potential surface of PAFC, as calculated [48] from the 6TRM structure deposited in pdb. Red means negative, and blue means positive surfaces. The scale is in kJ/mol/e. (B) Front view of cavity B of PAFC, formed predominantly by residues 3, 12, 13, 14, 28, 29, 30, 31, 33, 34, 35, 36, 44, 45, and 48.

