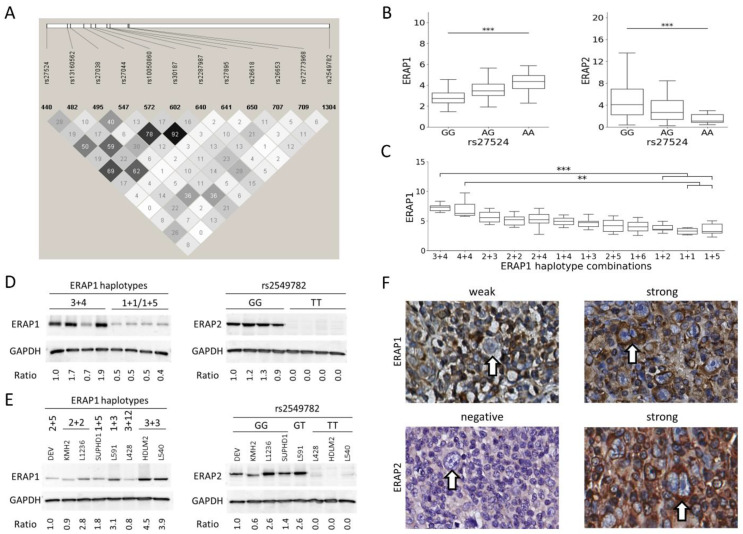
Figure 1.
ERAP1 and ERAP2 expression quantitative trait loci. (A) Linkage disequilibrium (LD) plot of the selected SNPs in the ERAP1 and ERAP2 genes. The darkness of diamonds shows the strength of LD, darker colour means stronger LD, the number in the diamonds represent r2 between two SNPs. (B) eQTL analysis of rs27524 SNP in LCLs on ERAP1 (left) and on ERAP2 expression (right). Significance was calculated with one-way ANOVA with linear regression. (C) eQTL analysis of the ERAP1 haplotype. Significance was tested using Kruskal-Wallis test with Dunn’s multiple comparison post-test. (D) ERAP1 and ERAP2 protein (p)QTL effect in LCLs by western blot. (E) pQTL analysis of the ERAP1 haplotypes (left) and of ERAP2 SNP rs2549782 (right) in HL cell lines by western blot. The ratio indicates the relative ERAP1 or ERAP2 protein level normalized by the GAPDH protein level. (F) Representative images of immunohistochemical staining of ERAP1 and ERAP2 in HL tumor tissue sections of nodular sclerosis and mixed cellularity subtype. Arrows indicate Hodgkin Reed-Sternberg cells. Statistically significant changes are indicated by ** = p ≤ 0.01, and *** = p ≤ 0.001.

