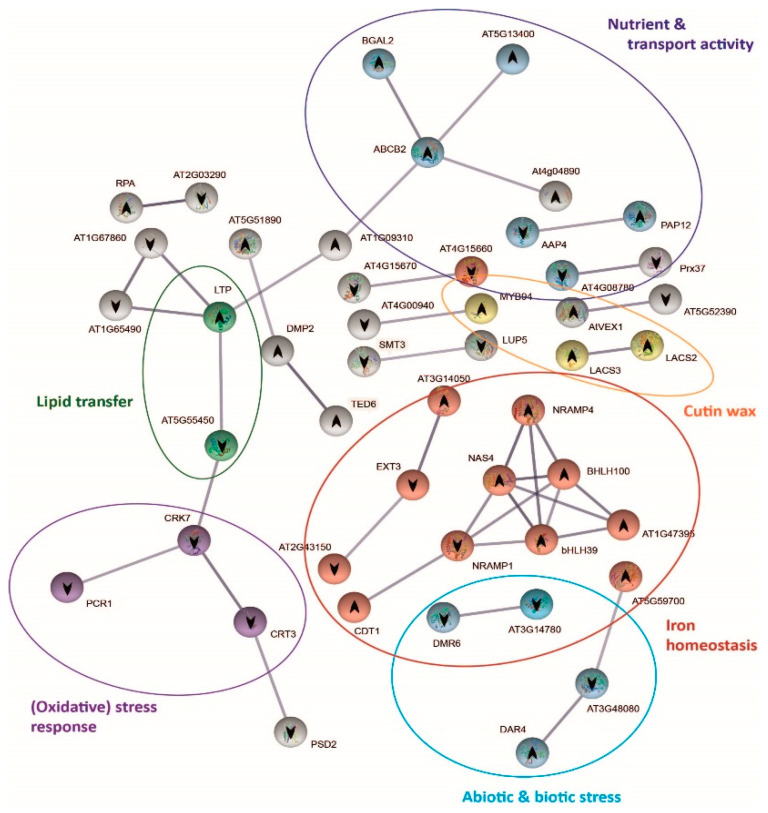
Figure 6.
Protein–protein interaction network functional enrichment analysis of specific genes derived from the response to bicarbonate of T6 (c−). Gene protein interaction network of T6(c−) exclusive DEGs from bic vs. pH 5.9 comparison after 3 h exposure. Each sphere corresponds to one gene and nodes represent protein interactions. Gene pathways are shown in different colors. Arrows indicate up or downregulation of the genes.

