
Figure 10.
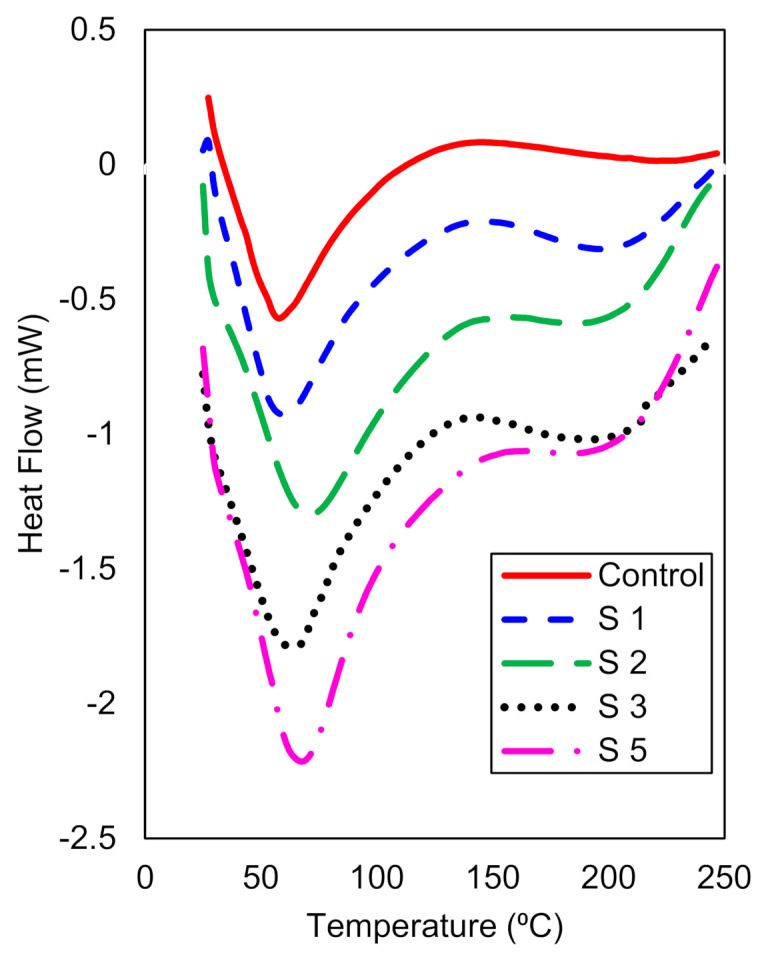
Differential scanning calorimetry (DSC) curves for control sample and some treated samples (S1, S2, S3 and S5; same codes as in Table 2).
Official websites use .gov
A
.gov website belongs to an official
government organization in the United States.
Secure .gov websites use HTTPS
A lock (
) or https:// means you've safely
connected to the .gov website. Share sensitive
information only on official, secure websites.
Differential scanning calorimetry (DSC) curves for control sample and some treated samples (S1, S2, S3 and S5; same codes as in Table 2).