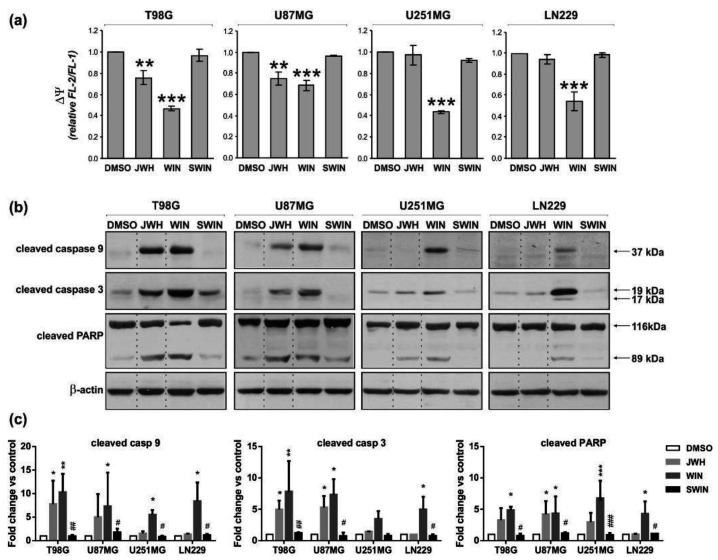
Figure 5.
Synthetic cannabinoids induce the dissipation of mitochondrial membrane potential and the activation of apoptotic caspases in glioblastoma cells. (a) Flow cytometric analysis of mitochondrial transmembrane potential (∆Ψ) was performed in control and cannabinoid-treated cells stained with the fluorescent probe JC-1. A decrease of the red (FL-2 channel)/green (FL-1 channel) fluorescence intensity ratio, normalized to the values from untreated controls, corresponds to a loss of mitochondrial membrane potential. Statistical significance of changes 24 h after exposure to WIN55,212-2 or JWH133 as compared to control cells (DMSO) was determined using ANOVA and is indicated as follows: ** p < 0.01, *** p < 0.001. The inactive enantiomer WIN55,212-3 (SWIN) did not induce changes in mitochondrial membrane potential in any cell line. (b) Synthetic cannabinoids-induced activation of caspase 9 and caspase 3, as indicated by the immunodetection of cleaved proteins, was evaluated at 36 h post-treatment. Caspase 3 activation was also evidenced by PARP proteolysis at 48 h post-treatment. Equal loading of proteins was ensured by β-actin immunodetection. (c) The graphs show the relative intensity of bands on immunoblots as compared to the control (DMSO-treated cells) and normalized to β-actin levels based on the densitometry analysis (the mean ± SD of at least two independent experiments). Statistical significance of changes was determined using two-way ANOVA and is indicated as follows: * p < 0.05, ** p < 0.01, *** p < 0.001 (vs. DMSO) and # p < 0.05, ## p < 0.01, ### p < 0.001 (SWIN vs. WIN).

