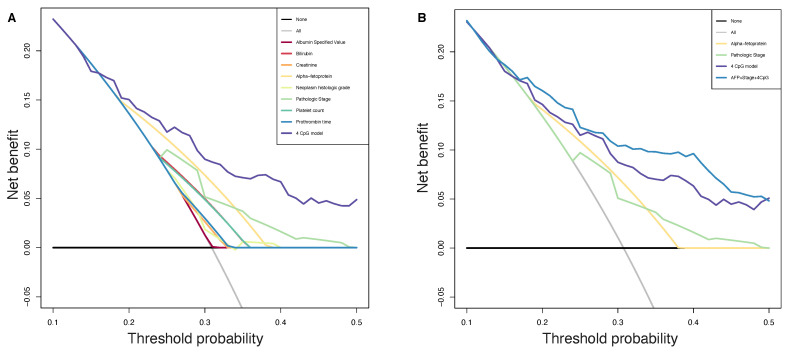
Figure 5.
Decision curve analysis. The plot shows the net benefit per patient relative to no intervention for any patient (“treat none”). The unit is the benefit for a patient who would have a PFS less than 6 months without intervention and who receives the intervention. Black line: assume no patient has a PFS less than 6 months. Grey line: assume all patients have a PFS less than 6 months. (A): All parameters are reported, purple line representing our CpGs based method achieving higher benefit than in-use parameters. (B): Pathologic stage, preoperative AFP, 4 CpGs risk score and model including all these three variables are reported, blue line shows that the benefit was even higher when we combined our model to strong prognosis factors.

