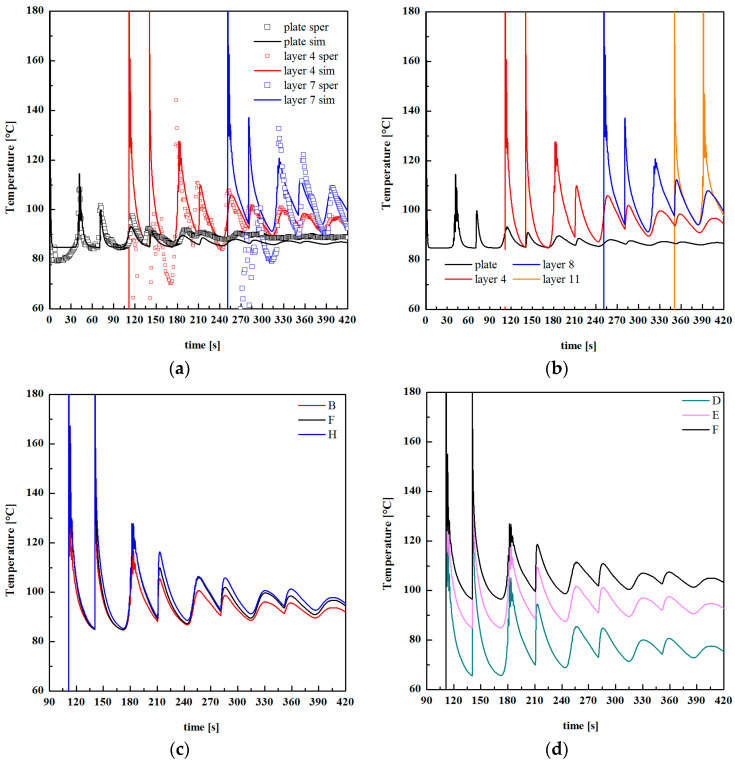
Figure 15.
(a) Comparison among temperature evolution recorded during FDM case F (symbols) and the simulated temperature evolution (lines); (b) temperature evolutions evaluated by simulation of different layers for the case F; (c) temperature evolutions evaluated by simulation of different layers for the cases B, F and G; (d) temperature evolutions evaluated by simulation of different layers for the case D and F.

