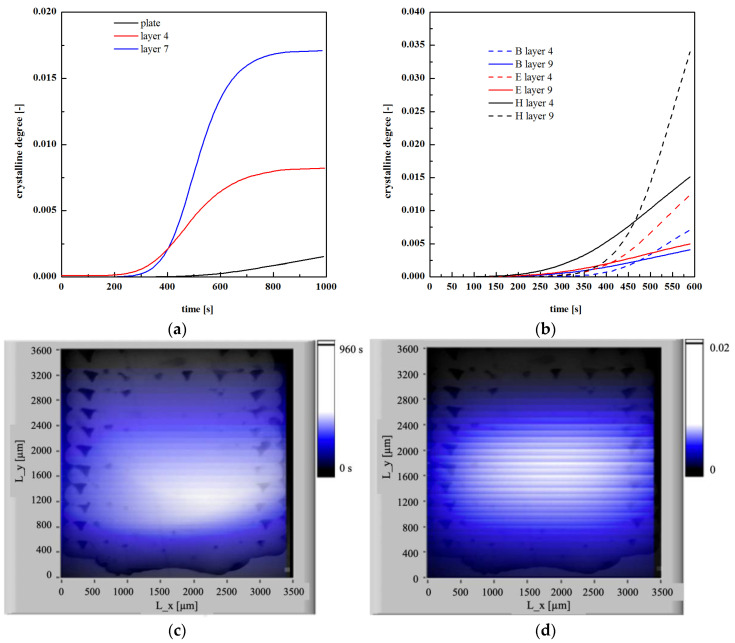
Figure 16.
(a) Crystallinity evolutions of different layers for the case E evaluated by simulation; (b) crystallinity degree evaluated at layer 4 and layer 9 for the cases B, E and H; (c) time the molecules spend above 90 °C for the case E; (d) crystallinity measured after 1000 s for the case E. The optical micrograph of the specimen E is also embedded in the graphs.

