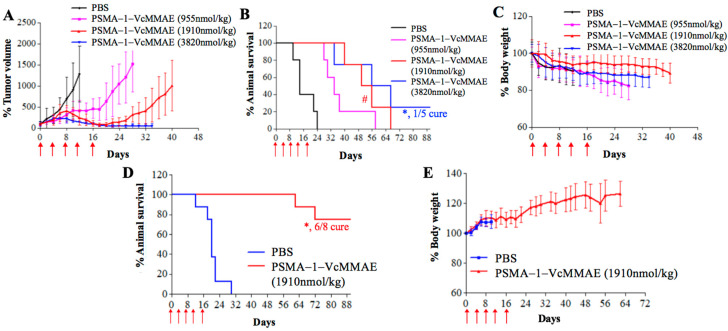
Figure 9.
In vitro antitumor activity studies of PSMA-1-VcMMAE in orthotopic (A–C) (n = 5) and metastatic tumor models (D,E) (n = 8). Mice received drug through tail vein injection. Treatments were scheduled every 4 days with a total of five doses as indicated by the red arrow. (A) Orthotopic PC3pip tumor growth curves of mice treated with PSMA-1-VcMMAE. Each group had five mice. Values are mean ± SD of five animals. The plots stopped when animals died during the experiments since values are represent as mean ± SD of five animals. (B) Kaplan–Meier survival curves of mice bearing orthotopic PC3pip tumor. (#, 1910 nmol/kg vs. PBS, p = 0.0449; *, 3820 nmol/kg vs. PBS, p = 0.0019). (C) Body weight changes of mice treated with PSMA-1-VcMMAE. Values are mean ± SD of five animals. The plots stopped when animals died during the experiments since values are represent as mean ± SD of five animals. (D) Kaplan–Meier survival curves of mice bearing metastatic PC3pip tumor. (*, 1910 nmol/kg vs. PBS, p = 0.0033). (E) Body weight changes of mice bearing metastatic PC3pip tumor treated with PSMA-1-VcMMAE. Values are mean ± SD of eight animals. The plots stopped when animals died during the experiments since values are represent as mean ± SD of eight animals.

