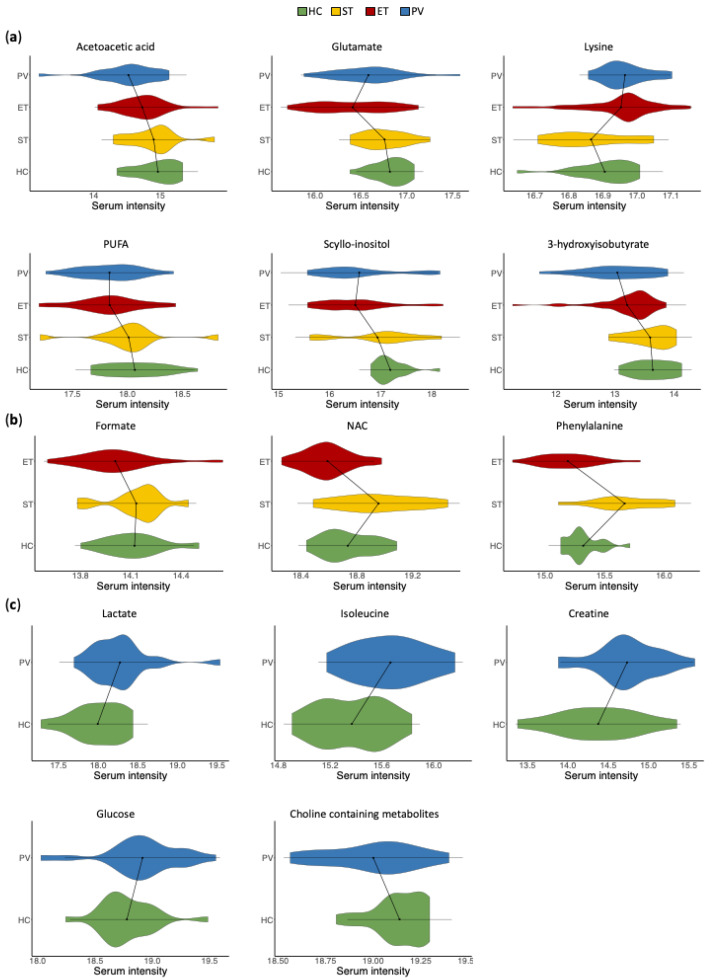
Figure 3.
Violin plots representing the serum intensities (logarithmic scale) of statistically significant metabolic changes. Statistically significant alterations between the groups of study were observed in (a) metabolites that showed changes in both PV and ET patients, when compared with HC; (b) metabolites that were altered in ET (but not in PV) patients when compared with HC and ST; and (c) metabolites that were altered in PV (but not in ET) patients when compared with HC. HC: healthy control, PV: polycythemia vera, ET: essential thrombocythemia, ST: secondary thrombocythemia. HC: healthy control, PV: polycythemia vera, ET: essential thrombocythemia, ST: secondary thrombocythemia. HDL: high-density lipoproteins, NAC: acetyl signals from glycoproteins, PUFAs: polyunsaturated fatty acids, VLDL: very-low-density lipoproteins.

