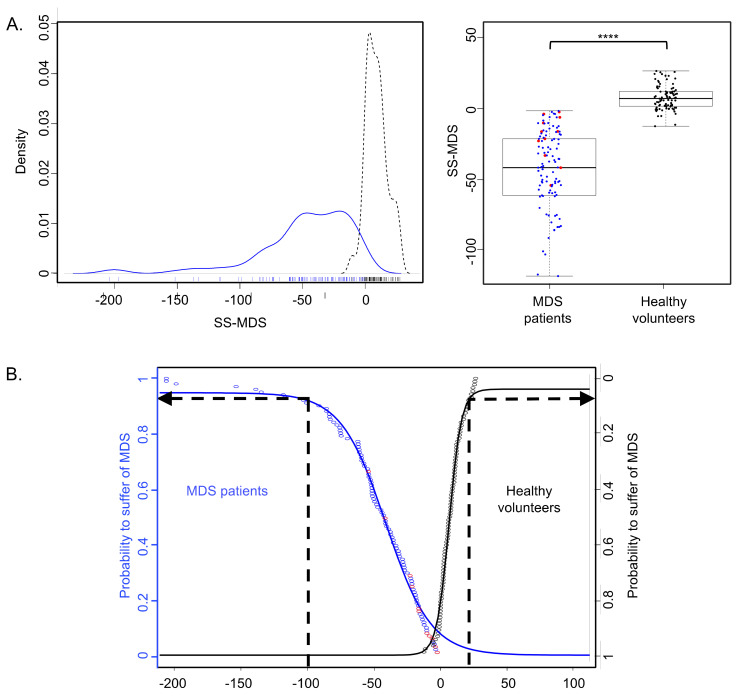
Figure 4.
MDS likelihood score (MDS-LS) of MDS patients (blue) and healthy volunteers (black). In red, the 11 MDS patients for whom the MDS-LS would have been decisional to trigger a blood smear (no blood smear with the classical procedure). (A) MDS-LS density (left panel) or boxplots (right panel) of MDS patients and healthy volunteers. The outliers are not shown in the boxplot representation. MDS-LS of both cohorts are significantly different (****: p < 0.0001). (B) Empirical cumulative distribution function. The vertical axis represents the probability to suffer from MDS. If the MDS-LS is negative, there is an increasing probability of MDS, justifying blood smear. For example, if the MDS-LS value is −100, this probability is 95.4%.

