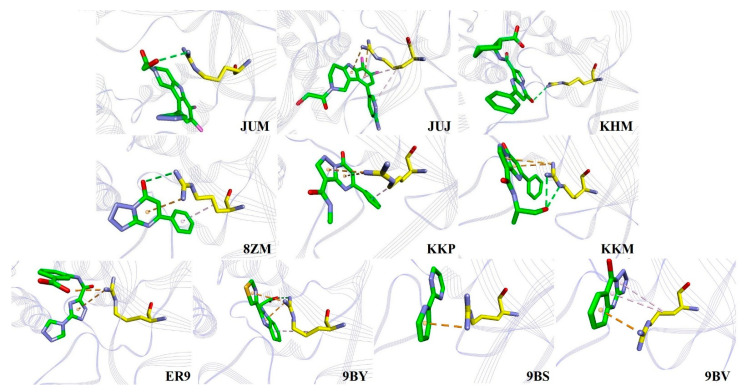
Figure 5.
The modes of binding of the 10 inhibitors with R376. The C atoms of the inhibitors and R376 are shown in green and yellow, respectively. The N, O, S, and Cl atoms are shown in blue, red, orange, and magenta, respectively. All the hydrogen atoms are hidden for clarity. The proteins are displayed as purple line ribbon. The green, orange, and light pink dashes represent the H-bonded, π· · ·cation or salt bridge, and C−H· · ·π interactions, respectively.

