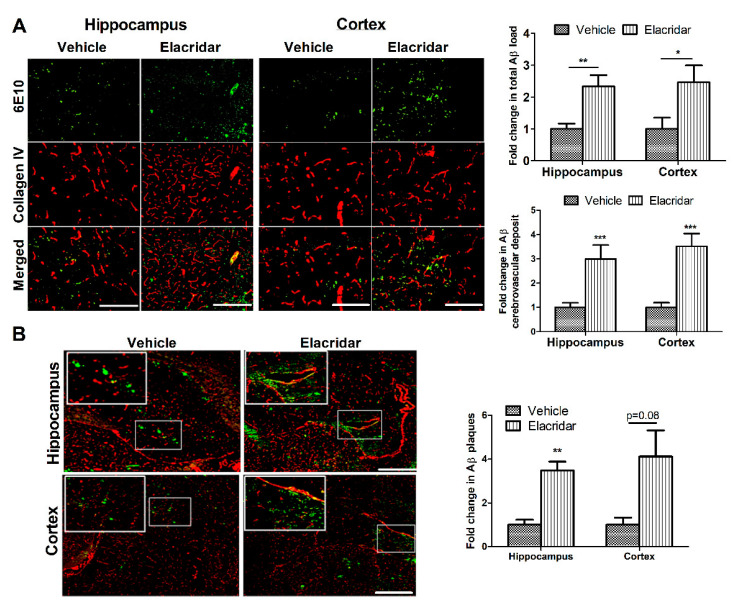
Figure 5.
Elacridar treatment increased brain Aβ burden in the brains of TgSwDI mice. (A) Representative brain sections from mice cortex and hippocampus regions stained with 6E10 (green) antibody against Aβ to detect total Aβ load and anti-collagen IV (red) to stain microvessels. Semi-quantification analysis of both regions showed a significant increase in parenchymal Aβ burden and cerebrovascular Aβ deposit. (B) Representative brain sections stained with ThioS (green) and anti-collagen IV (red) to stain microvessels in cortex and hippocampus regions, with the corresponding quantification of the area covered with Aβ plaques (ThioS). The top white square is a magnification of the small square showing increased Aβ deposit on the microvessels caused by elacridar. The semi-quantification analysis is presented as fold change caused by elacridar when compared to vehicle treatment. Scale bar = 100 μm. Statistical analysis was determined by Student’s t-test. Data are presented as mean ± SEM of n = 5 mice per group, * p < 0.05, ** p < 0.01, *** p < 0.001 compared to vehicle-treated group.

