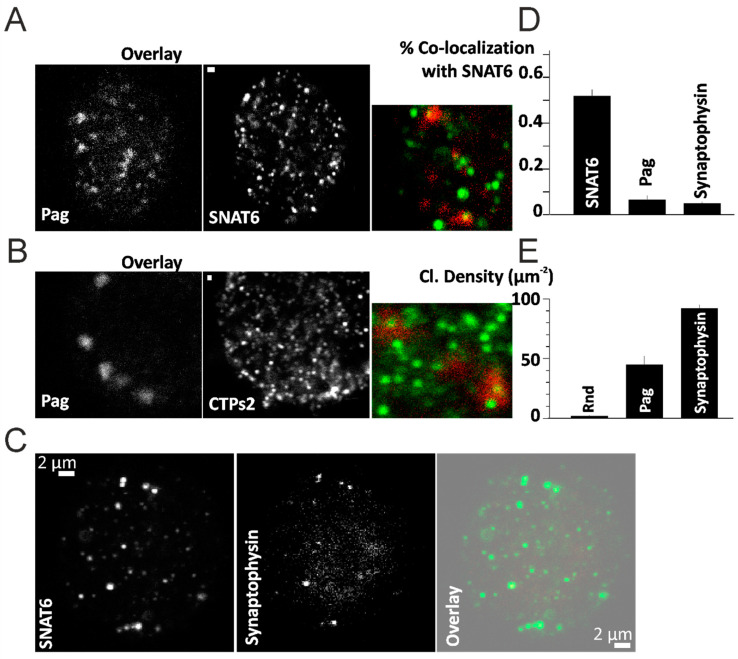
Figure 2.
Localization of Pag and Synaptophysin. (A) Immunostained images of Pag and SNAT6 with an overlay image in the inset. (B) Immunostained images of Pag and CTPs2 with an overlay image in the inset. Scale bar 2 µM in (A,B). (C) Immunostained images of SNAT6 and Synaptophysin with an overlay image on the right. Scale bar 2 µM in (C). (D) Co-localization of SNAT6 with Pag and Synaptophysin measured as described in the methods. Random (Rnd) regions selected were used as control. Both Pag and Synaptophysin co-localized with SNAT6 at a significantly (p < 0.001) higher percentage compared to Rnd regions (E) Density of clusters of SNAT6, Pag and Synaptophysin was assessed as described in the methods. Note of density of SNAT6 which is significantly (p < 0.001) higher than Pag or Synaptophysin. All the experiments in the figure were repeated for 2–3 times each with each of the bar graph representing more than 15 cells obtained from separate experiments.

