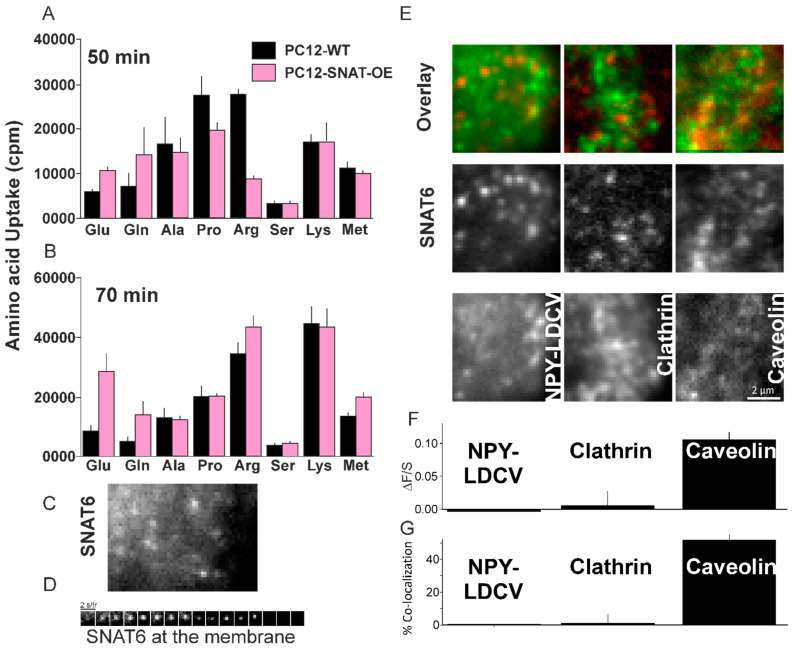
Figure 4.
Role of SNAT6 in amino acid uptake and internalization. (A) Uptake in counts per minute (cpm) for 50 min by wildtype PC12 cells and PC12 cells overexpressing SNAT6 are plotted. (B) Uptake in counts per minute (cpm) for 70 min by wildtype PC12 cells and PC12 cells overexpressing SNAT6 are plotted. 3H-labeled Glutamine, glutamate, alanine, proline, arginine, serine, lysine and methionine are used for both time points. All measurements were performed in duplicates for multiple times and mean value is shown. Significantly higher uptake (p < 0.001) is shown for the amino acids - glutamine and glutamate in PC12-SNAT6-OE cells compared to PC12-wt cells after 50 mins. (C) A TIRF microscopy image showing cells overexpressing SNAT6-EGFP at the plasma membrane (D) Time series strip showing disappearance of SNAT6-EGFP from the plasma membrane in presence of glutamine. (E) Images of a cell overexpressing SNAT6-EGFP in red with NPY-mCherry or Clathrin-mCherry or Caveolin-mCherry in green channels respectively with a corresponding image in the overlay. (F) Quantification of binding to the SNAT6 site (ΔF/S) for NPY, clathrin and Caveolin respectively (described in methods). Localization of SNAT with Caveolin was significantly higher compared to NPY or clathrin (p < 0.001). (G) Co-localization from the images similar to E were analyzed (described in methods). SNAT co-localization with caveolin was significantly higher than its co-localization with NPY of clathrin (p < 0.005). All the TIRF imaging experiments were repeated at least 3 times with at least 8 cells per time.

