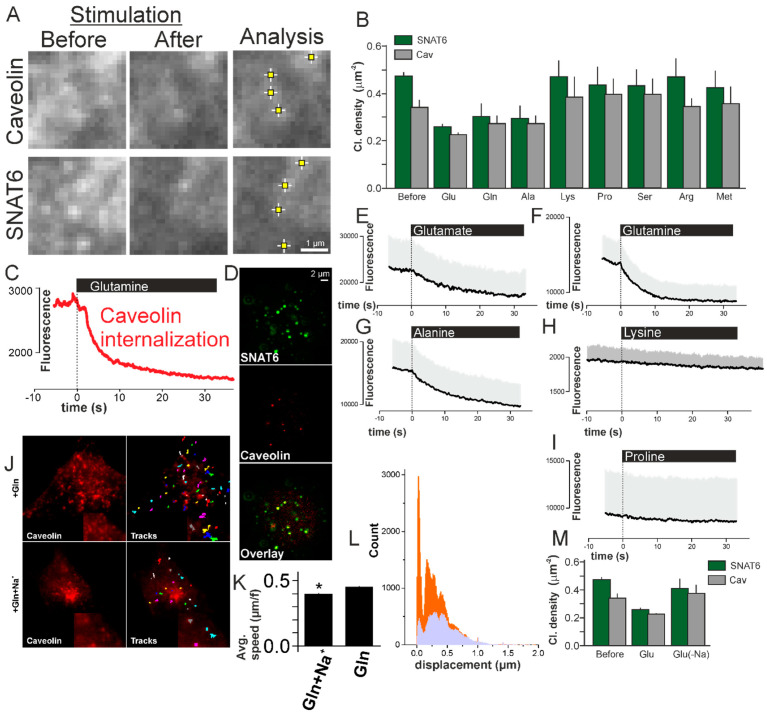
Figure 5.
SNAT6 associated caveolin complexes internalize in response to glutamine and glutamate in a Na+ dependent manner. (A) Images of cells expressing SNAT6-EGFP and Caveolin1-mCherry under TIRF microscopy before and after stimulation with glutamine. An ImageJ plugin (described in methods) detecting the SNAT6 and caveolin clusters. (B) Density of SNAT6 (green) and Caveolin (grey) clusters quantified using the method above before and after stimulations with different amino acids specified in the figure (density of clusters was significantly decreased under Glu, Gln, and Ala, p < 0.001). (C) Trace showing fluorescence of the entire single cell for caveolin. Note that the stimulation with glutamine was initiated at time zero. (D) Images from antibody labeled SNAT6 and caveolin localizing together (44 ± 7% in six cells derived from two independent experiments). (E) Similar to C but showing average fluorescence for 10 cells from three different transfections under glutamate stimulation. (F–I) Similar to E for cells stimulated with glutamine (11 cells), alanine (13 cells), lysine (12 cells), and proline (9 cells). All the experiments were performed from at least three different transfections. (J) Images showing caveolin-mCherry expressing cells with and without Na+ present in the buffer when stimulated with glutamine. Tracks obtained from Metamorph tracking (described in methods) during the entire time sequence. zoomed tracks and images in the inset (K) Average speed for the tracks in (J) in presence and absence of Na+ in the buffer under glutamine stimulation (* p < 0.05). (L) Histogram of 16–60 tracks from 9 different cells per condition similar to the cell shown in (I). Displacement of caveolin in presence (lavender) and absence (orange) of Na+ in the buffer under glutamine stimulation. (M) Density of SNAT6 (green) and Caveolin (grey) clusters quantified as in B before and after stimulations with glutamine in presence and absence of Na+ in the buffer.

