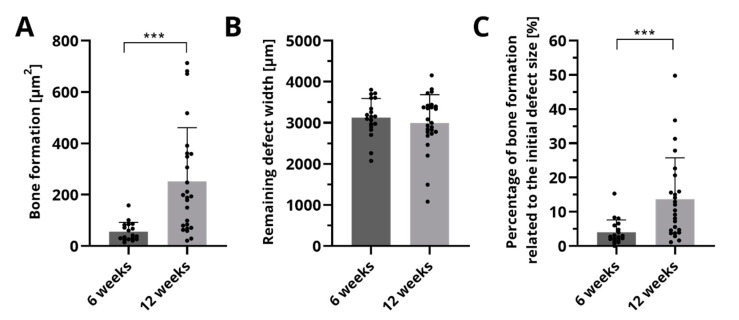
Figure 6.
Histomorphometric analysis of bone formation (A), the remaining defect width (B) and the percentage of newly formed bone (C). Displayed are mean ± SD, *** p < 0.001, n = 19 and n = 25 for 6 and 12 weeks, respectively. The points mark the actual measured values of the histological sections.

