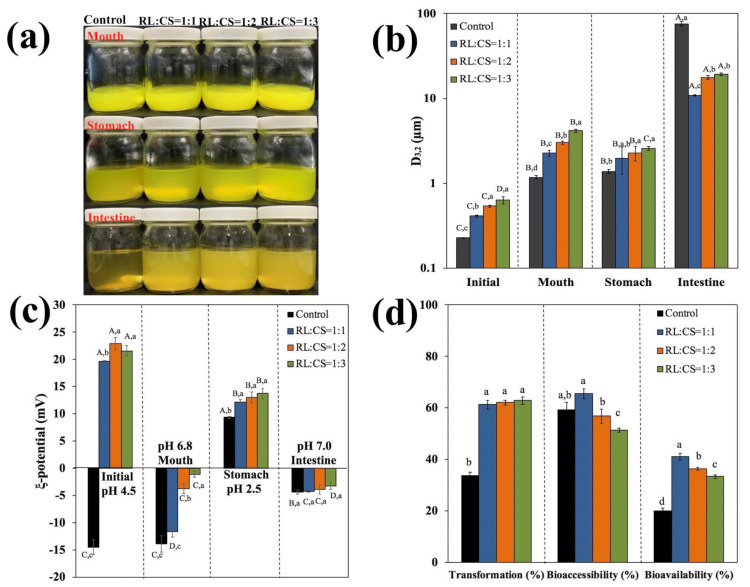
Figure 7.
Visual appearance (a), particle size (b), ζ-potential (c) of Cur-loaded liposomes with different ratios of RL/CS during the digestion phases; (d) curcumin transformation, bioaccessibility and bioavailability percentages for Cur-loaded liposomes with different ratios of RL/CS during the digestion phases. Samples denoted by different capital case letters (A–D) were significantly different (p < 0.05) when compared between different GIT regions (same RL/CS ratios). Samples denoted by lowercase letters (a–c) were significantly different (p < 0.05) when compared between different RL/CS ratios (same GIT region).

