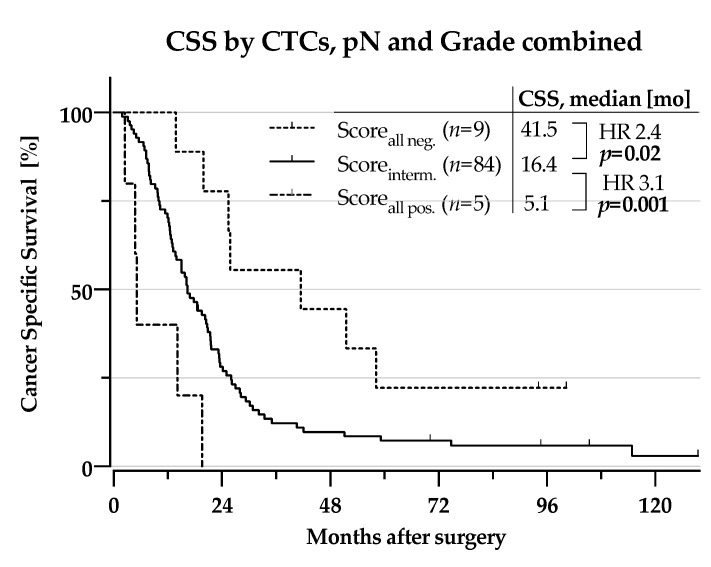
Figure 5.
Kaplan-Meier curves for survival times: Cancer specific survival by combination of CTCs, pN1 and Grade > 2 into a score for the entire cohort. Scoreall neg.: all three negative, Scoreinterm.: one or two factors positive, Scoreall pos.: all three positive, CSS: cancer-specific survival, CTC: circulating tumour cell, HR: Hazard ratio. Statistical significance assumed for p < 0.05, indicated by use of bold font.

