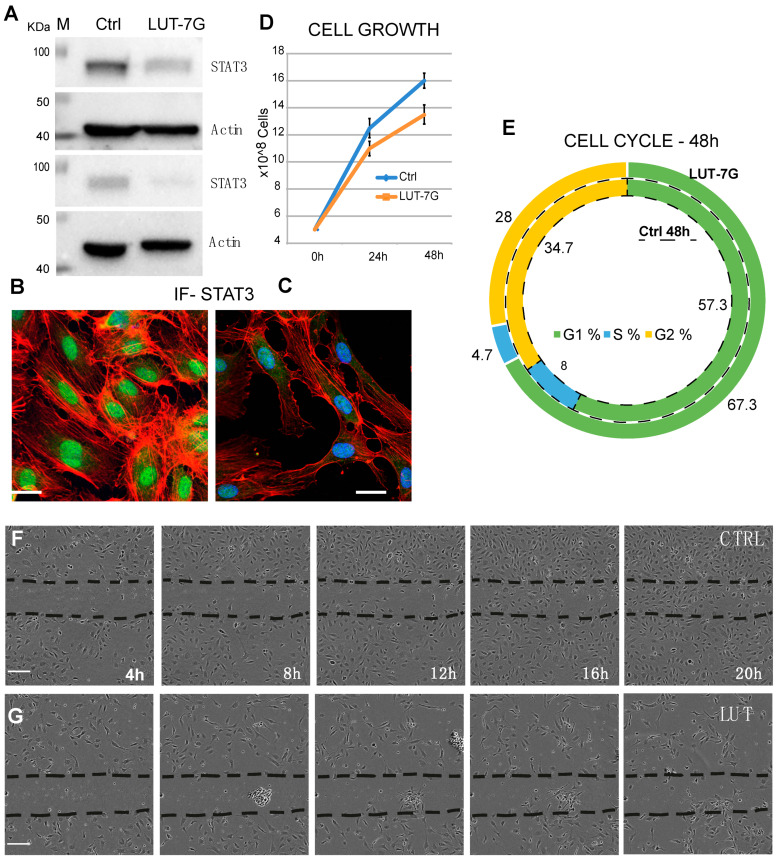
Figure 2.
LUT-7G treatment of endothelial cells. (A) WB showing the regulation of STAT3 protein before (left lanes) and after LUT-7G treatment (right lanes, two independent experiments). (B,C) Immunofluorescence analysis showing STAT3 in the nucleus (active STAT3) in untreated cells and STAT3 nuclear depletion after 48 h of LUT-7G treatment (bars = 15 μm). (D,E) Cell Growth and Cell cycle analysis showing proliferation reduction and G1 enrichment in treated samples. (F) Scratch assay in untreated cells, (G) same assay from 4 to 20 h (bars = 60 μm).

