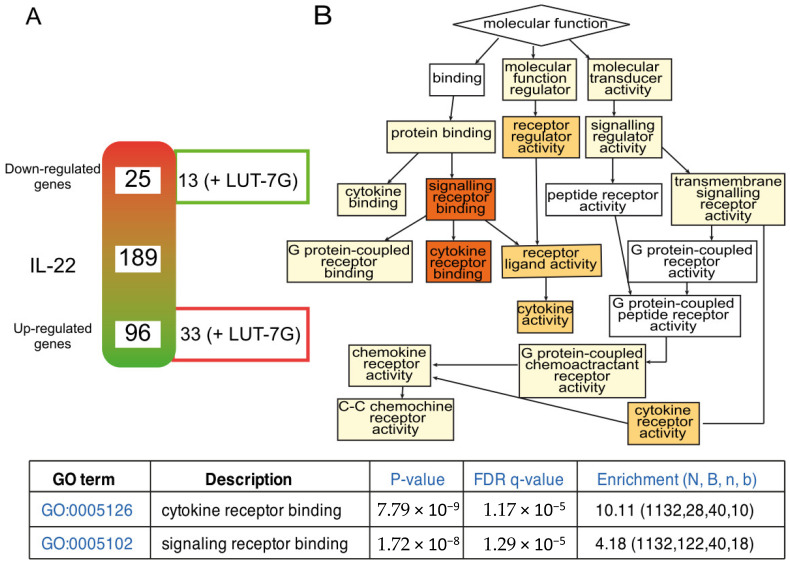
Figure 4.
Inflammatory gene expression regulated by LUT-7G treatment, and clusterization analysis. (A) schematic representation of modulated genes after IL-22 treatment. The array contains in total 189 genes. On the right site of the gradient diagram, are represented the number of genes of which the treatment with LUT-7g reverts the effects of IL-22. (B) Clusterization function pathway obtained using the regulated genes. FDR is False Discovery Rate; N total number of genes; B total number of genes associated with a specific GO term; n is the flexible cut-off. Enrichment is defined as (b/n)/(B/N).

