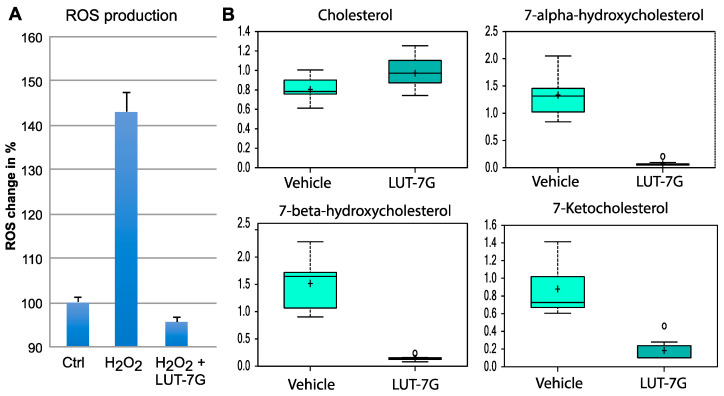
Figure 5.
Oxidative stress and fatty acids hydroxylation analysis. (A) ROS production analysis, the results are presented in % units considering the control as 100%. (B) LUT-7G treatment affects cholesterol levels, which increase, and levels of hydroxylated species, which decrease dramatically. Data are shown as mean and standard deviation. Welch’s two-sample t-test was used to identify biochemicals that differed significantly between experimental groups. A p < 0.05 was considered significant (see Section 4).

