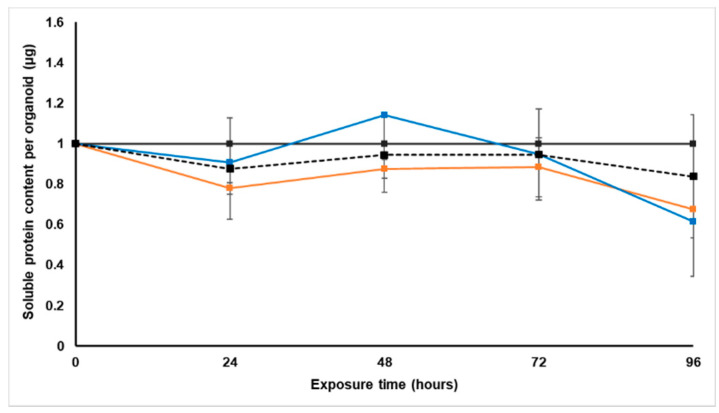
Figure 2.
Normalized soluble protein content per spheroid (µg) of the sodium alginate encapsulated LS180 mini-tumor model, following 96 h exposure to Sutherlandia frutescens aqueous extract or paclitaxel. The solid black line represents the untreated control, the black dashed line represents paclitaxel [IC50], the orange line represents S. frutescens [IC50], and the blue line S. frutescens [IC50]/2. All data were normalized to the untreated control group (error bars = standard deviation, n = 3 for S. frutescens [IC50]/2 and n = 6 for S. frutescens [IC50] and paclitaxel [IC50]).

