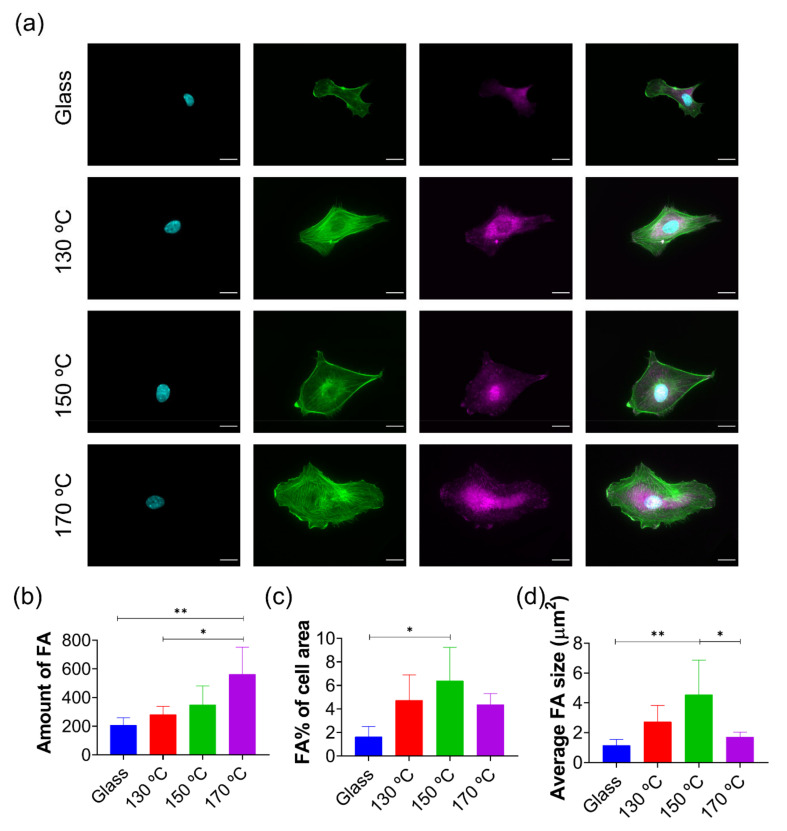
Figure 3.
HUVECs FA quantification on PGS substrates. (a) Immunofluorescence images of HUVEC nuclei (cyan), actin cytoskeleton (green) and vinculin (magenta) as a focal adhesion (FA) marker of cells cultured after 3 h on glass and different PGS cured materials. Quantification of (b) the amount, (c) area and (d) average size of FA. FA area was calculated as the percentage of the total cell area. All immunofluorescence images share the same scale bar (20 µm). Sample data distributions were analysed through a one-way ANOVA and Bonferroni post hoc multiple mean comparison test, with a p-value < 0.05. *, p < 0.05 and ** p < 0.01.

