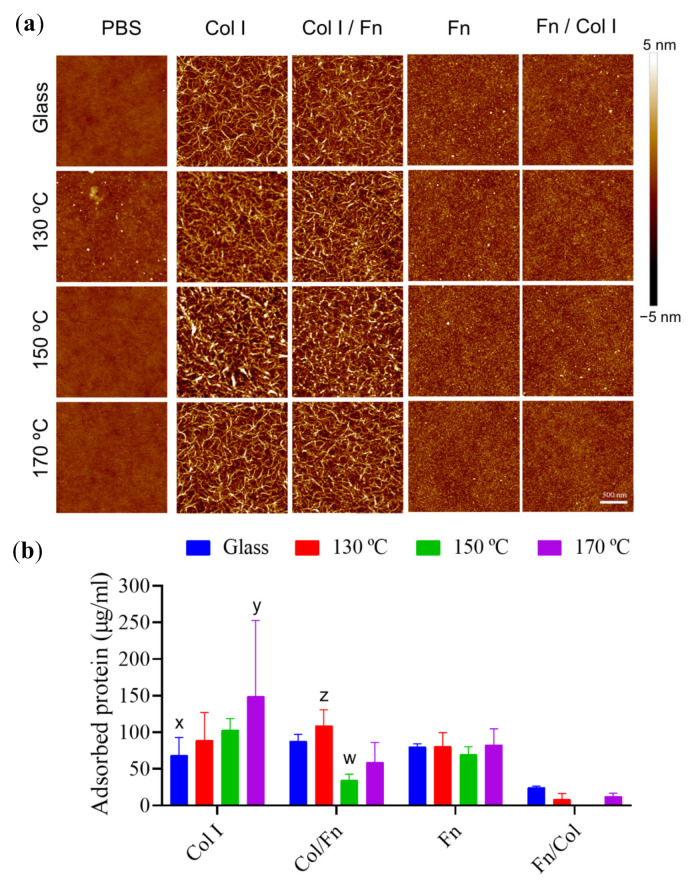
Figure 4.
Sequential protein adsorption on PGS substrates. (a) Atomic force microscope (AFM) height images of 2 × 2 µm2 and (b) protein adsorption quantification from microBCA colorimetric technique with single protein (Fn 100 μg/mL or Col I 400 μg/mL) and sequential adsorption assays of Fn and Col I (Fn 100 μg/mL+ Col I 80 μg/mL), and vice versa (Col I 400 μg/mL + Fn 20 μg/mL) on PGS cured at different temperatures. The first column in (a) shows the presence of PGS on the glass with no major difference in height for any of the applied curing temperatures. All images share the 500 nm scale bar. Glass covers without spin-coated PGS are shown in (b) as control. Sample data distributions were analysed through two-way ANOVA and a Bonferroni post hoc multiple mean comparison test, with a p-value of 0.01.

