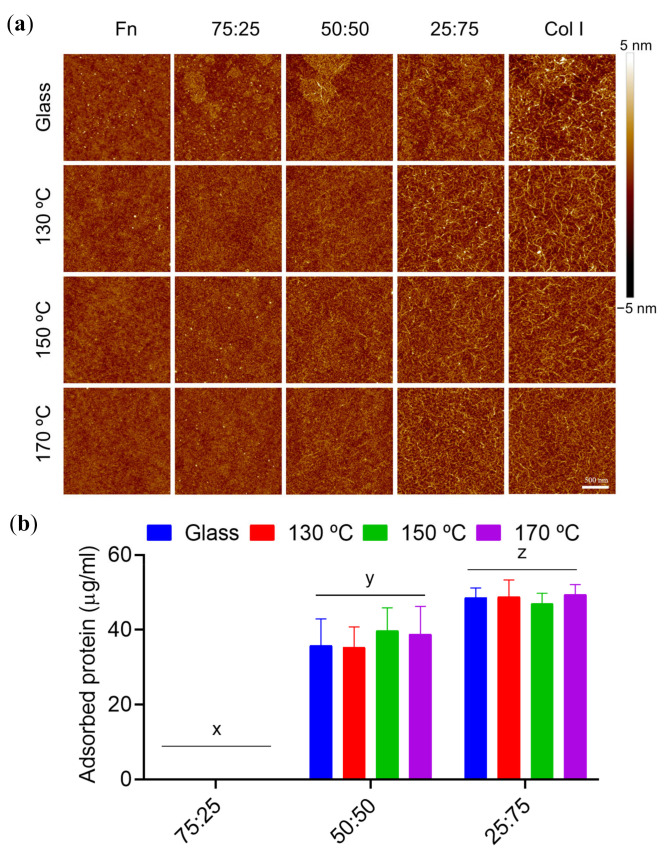
Figure 5.
Protein competition adsorption on PGS substrates. (a) AFM height images of 2 × 2 µm2 and (b) protein adsorption quantification from microBCA colorimetric experiments after competition adsorption assays with Fn and Col I on glass and PGS cured at different temperatures. The indicated percentages of intermediate protein mixtures are volumetric ratios of Fn 10 µg/mL over Col I 40 µg/mL. All images share the scale bar of 500 nm. Sample data distributions were analysed through a two-way ANOVA and Bonferroni post hoc multiple mean comparison test, with a p-value of 0.0001.

