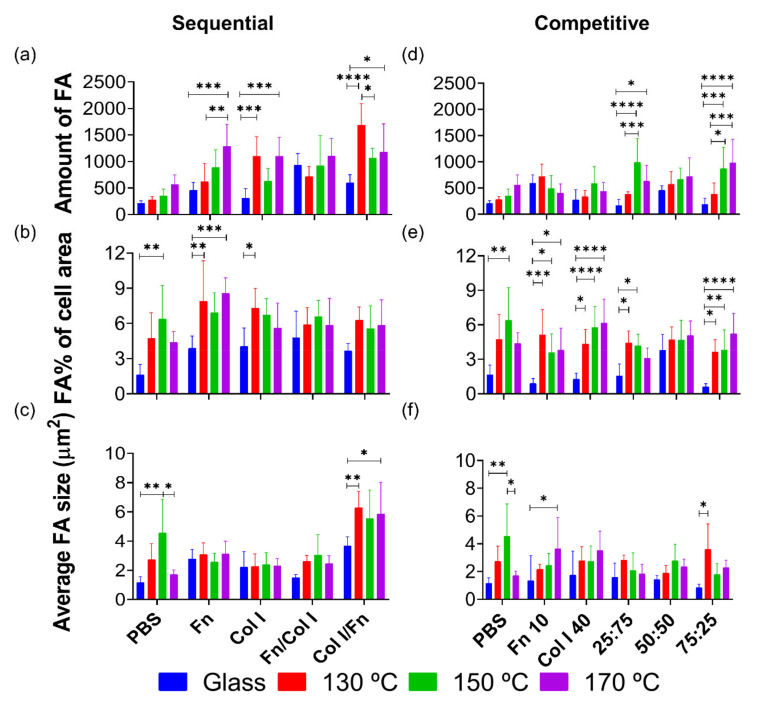
Figure 6.
FA parameters of HUVECs cultured on PGS substrates pre-treated in (a–c) sequential and (d‒f) competitive protein adsorption experiments. HUVECs fluorescence quantification of (a,d) number of FA, (b,e) relative surface of FA compared to the total cell area and (c,f) average size of FA, from protein sequential and competitive adsorption assays on glass and PGS cured at different temperatures. FA area was calculated as a percentage (%) of the total cell area. Sample data distributions were analysed through a two-way ANOVA and Bonferroni post hoc multiple mean comparison test, with a p-value < 0.05. *, p < 0.05; **, p < 0.01; ***, p < 0.001; and ****, p < 0.0001.

