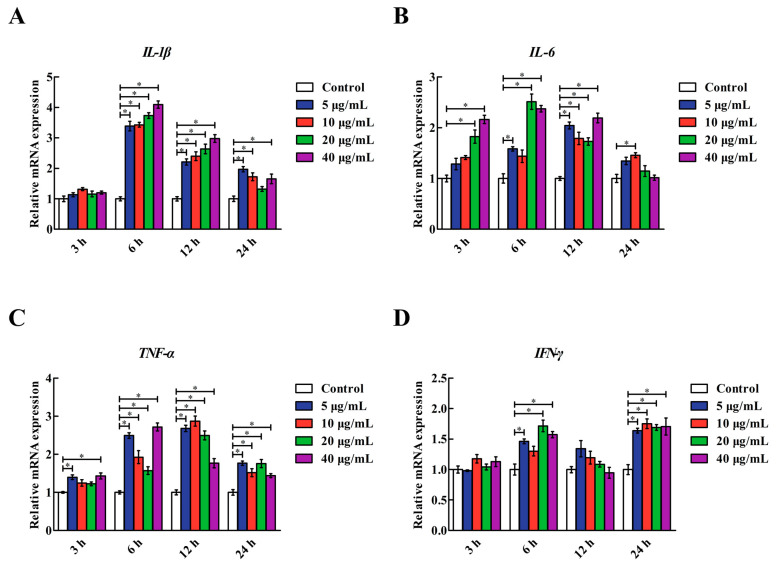
Figure 1.
Effects of various LPS concentrations and reaction times on the IL-1β, IL-6, TNF-α and IFN-γ mRNA levels in IPEC-J2 cells. (A) IL-1β: interleukin-1β. (B) IL-6: interleukin-6. (C) TNF-α: tumour necrosis factor-α. (D) IFN-γ: interferon-γ. Cells were treated with various concentrations of LPS (0, 5, 10, 20 and 40 μg/mL) for 3, 6, 12 and 24 h. Data are presented as the mean ± standard error (n = 4). * Means significant difference compared with the control group (p < 0.05).

