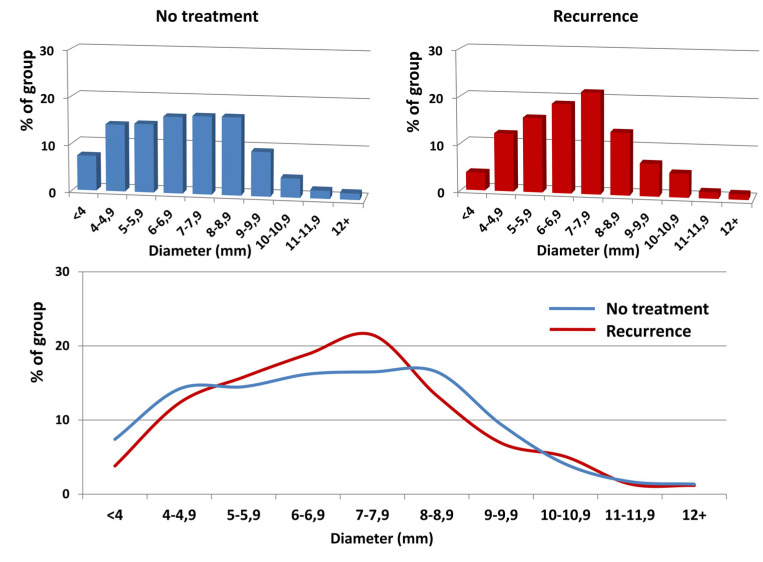
Figure 2.
The distribution of left ovarian vein diameters (horizontal axis) in regards to their frequency (vertical axis) in the analyzed groups. The upper graphs show the distribution in each group; the lower graph shows the overlaid data from the upper graphs. Despite a marked shift in the prevalence of the LOV diameters towards patients with a diameter >6 mm in the “Recurrence” group, this difference appeared non-significant (OR 1.22; 95% CI 0.81–1.84; P = 0.33).

