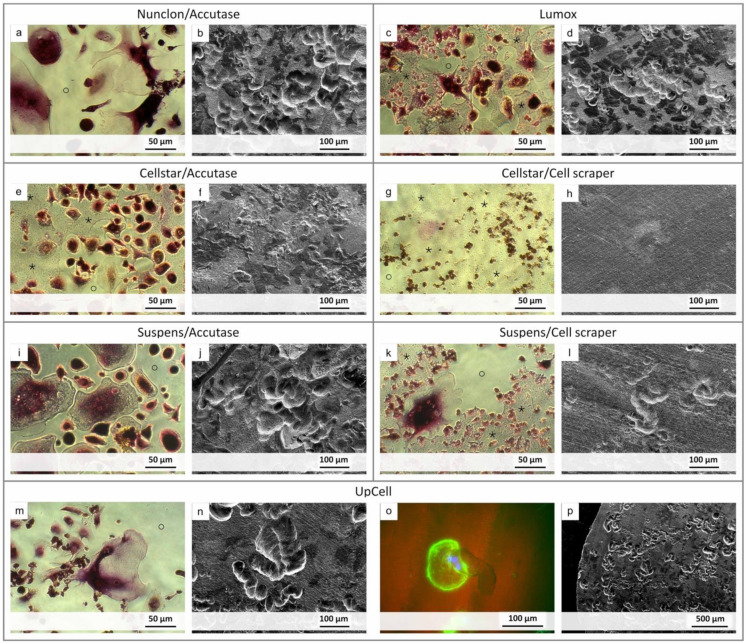
Figure 7.
Images showing the resorption activity of the detached osteoclasts after reseeding. Light micrographs after TRAP staining of the cells show resorption (marked as o) of the decellularized osteoblast-derived matrix layer (marked as *) ((a,c,e,g,I,k,m) for each detachment method). SEM images show resorption lacunas on dentin discs ((b,d,f,h,j,l,n,p) respectively). Special focus was put on UpCell-generated osteoclasts, where one is exemplary shown in a resorption lacuna (fluorescence image with actin skeleton shown in green and the nuclei in blue, UpCell (o)).

