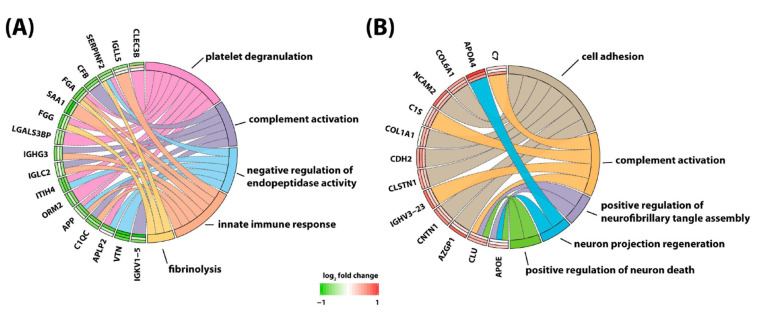
Figure 2.
Protein to biological pathway linkages for proteins in two clusters, (A) cluster 1 and (B) cluster 2, based on hierarchical clustering analysis. The significantly altered proteins (ANOVA, adjusted p value < 0.1) are linked to pathways as color-coded ribbons. Green-to-red rectangles next to the altered proteins indicate the magnitude of the log2 fold change (FC), where the inner layer represents the FC of week 1 in comparison with week 5, the middle layer represents the FC of week 1 in comparison with weeks 10−14, and the outer layer represents the FC of week 1 in comparison with weeks 24−28. Figure is reprinted from Yu et al., Isobaric Labeling Strategy Utilizing 4-Plex N, N-Dimethyl Leucine (DiLeu) Tags Reveals Proteomic Changes Induced by Chemotherapy in Cerebrospinal Fluid of Children with B-Cell Acute Lymphoblastic Leukemia. J. Proteome Res. 2020, 19, 2606–2616 [79]. Copyright (2020) American Chemical Society.

