Figure 1.
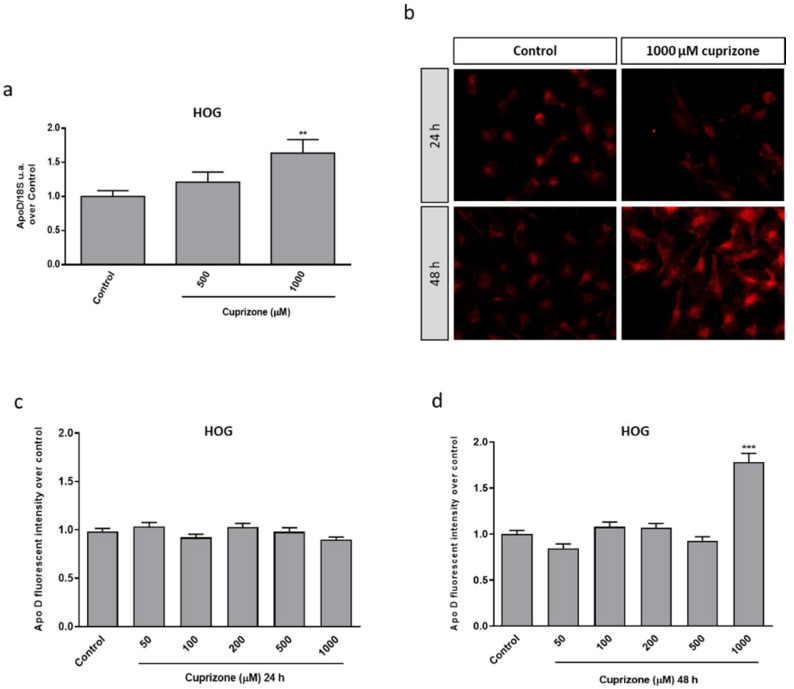
Relative Apo D gene expression in HOG cells treated with 0–1000 μM of CPZ following 24 h. Data represent the quotient between the gene and the expression of the housekeeping gene 18S rRNA. Bars represent the mean ± SEM of all measurements (n = 6–8) (a). Representative fluorescence microscopy images of Apo D levels in HOG cells treated or not with 1000 μM of CPZ during 24 and 48 h. 40× magnification (b). Densitometric quantification of Apo D immunocytochemical signal after 24 (c) and 48 h (d) of treatment with increasing concentrations of CPZ (50–1000 μM) in HOG cells (n = 6). Bars represent mean density per cell in a 40× field ± SEM (over control). Significant differences were analyzed by a one-way ANOVA followed by post-hoc Tukey’s test. ** p < 0.01, *** p < 0.001 compared with control.

