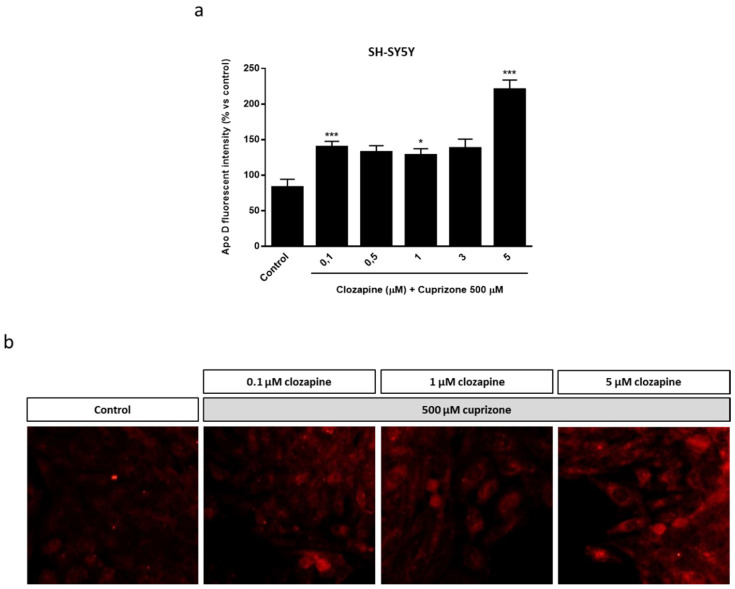
Figure 7.
Densitometric quantification of Apo D immunocytochemical signal in SH-SY5Y cells after 24 h of treatment with increasing concentrations of CLO (0.1–5 μM) followed by 24 h with 500 µM of CPZ (n = 6). Bars represent mean density per cell in a 40× field ± SEM (% versus control). Significant differences were analyzed by a one-way ANOVA followed by post-hoc Tukey’s test. * p < 0.05, *** p < 0.001 compared with control (a). Representative fluorescence microscopy images of Apo D expression in SH-SY5Y cells treated with increasing concentrations of CLO (0.1–5 μM) followed by 24 h with 500 µM of CPZ. 40× magnification (b).

