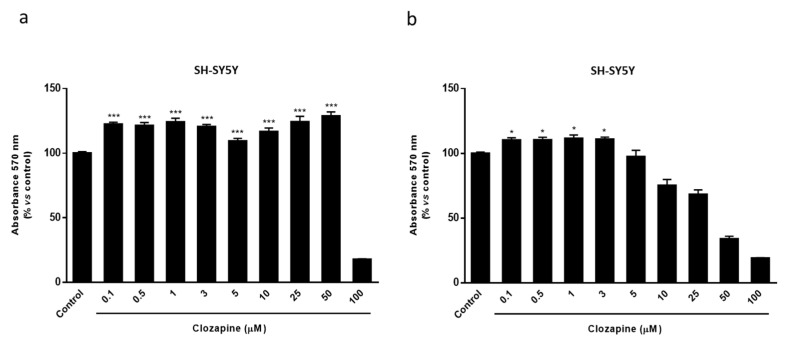
Figure A2.
MTT assay in SH-SY5Y cells treated with increasing concentrations of CLO (0.1–100 μM) during 24 h (a) and 48 h (b). Cell damage is represented as the percentage of viability versus control. Data are the mean ± SEM of five independent experiments. Significant differences were analyzed by a one-way ANOVA followed by post-hoc Tukey’s test. * p < 0.05, *** p < 0.001 compared with control.

