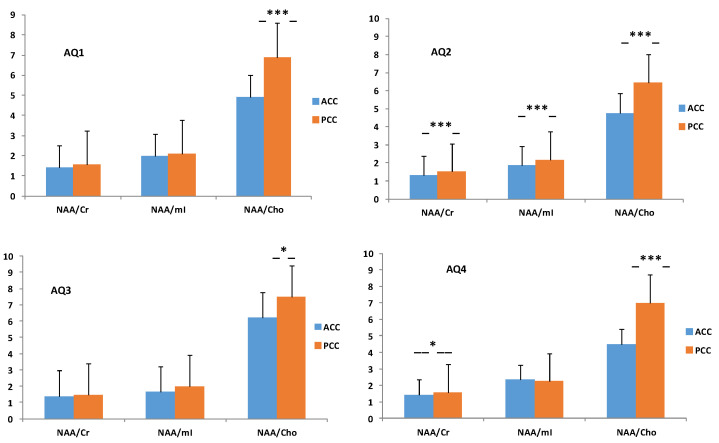
Figure 3.
Differences in the means of the NAA/Cr, NAA/mI, and NAA/Cho ratios between the ACC and PCC in the AQ1 (28.3%; n = 17), AQ2 (43.3%; n = 26), AQ3 (10.0%; n = 9), and AQ4 (18.3%; n = 13) groups. The AQ1 group was taken as a reference or control. p < 0.05 considered significantly different. -*-, -***-, significant at p < 0.05, 0.001, respectively.

