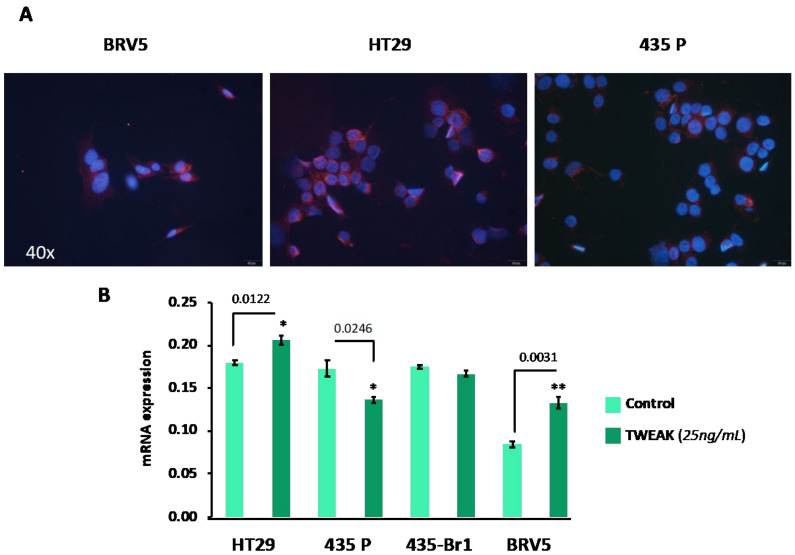
Figure 1.
Characterization TWEAK-dependent/not dependent cells. (A) Representative images of Fn14 expression (pink) in BRV5, 435-P and HT29 cells labelled by immunofluorescence. The protein has similar expression in BRV5 and the positive control HT29 cells, and less expressed in 435-P. DAPI (blue) was used for nucleus identification. (B) RT-PCR analysis to quantify Fn14 gene expression of cells cultured in the presence (dark green) or absence (light green) of TWEAK (25 ng/mL) at 48 h. Up-regulation of Fn14 is observed only in HT29 and BRV5 cells. Bars and error bars represent the average and standard deviation as calculated from three replicates respectively. P values represented as: * - significant (Pvalue: 0.01 to 0.05) and **- very-significant (Pvalue: 0.001 to 0.01).

