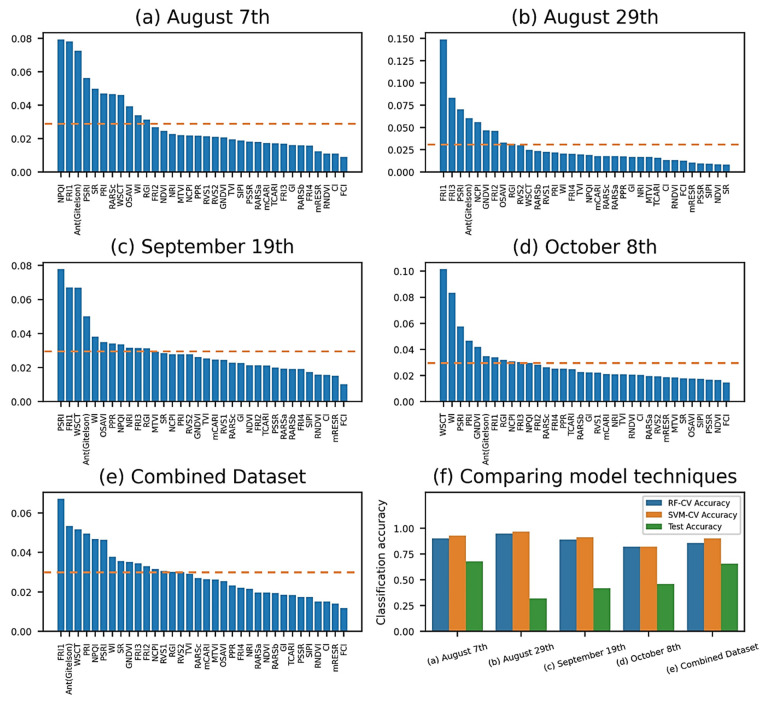
Figure 7.
Mean decreased impurity (MDI) feature importance among datasets (a–e). The normalized scores for 34 VIs were ranked by their respective classification ability. The dashed lines indicate the mean of the scores, which was a threshold used to allow selected VIs to enter the machine learning pipeline. Vegetation-index-based classification performance (f). In the training process, 5-fold cross validation accuracies from SVM pipelines (orange bars) were uniformly higher than the ones from RF pipelines (blue bars), and thus SVM pipelines were selected for testing (green bars).

