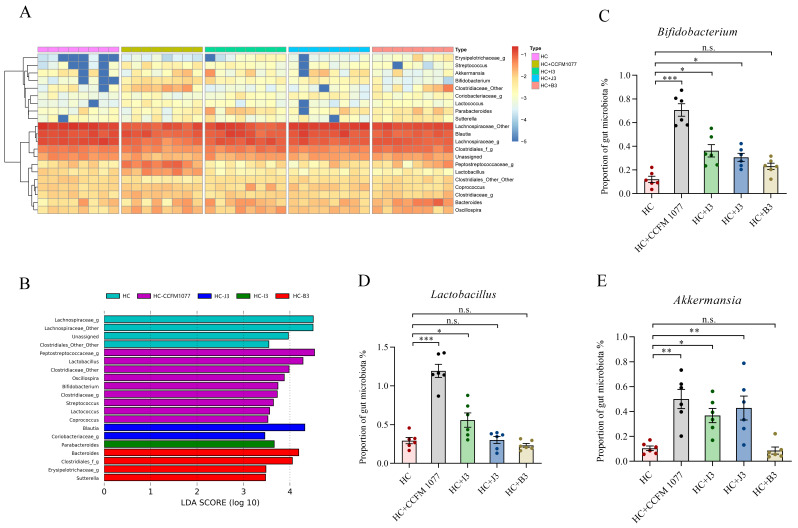
Figure 7.
The relative abundance of the main genus after consumption of high-cholesterol diet and administration of B. longum strains. (A) Relative abundance (%) heatmap including all fecal samples. Sample clustering is shown on the left-hand side. (B) LEfSe analysis of the specific difference in the genus level in different groups. (C) The abundance of Bacterium in the feces. (D) The abundance of Lactobacillus in the feces. (E) The abundance of Akkermansia in the feces. Data are presented as means ± standard error of the mean, n = 6. *** represents p < 0.001, ** represents p < 0.01, * represents p < 0.05, n.s represent non-significant with p > 0.05.

