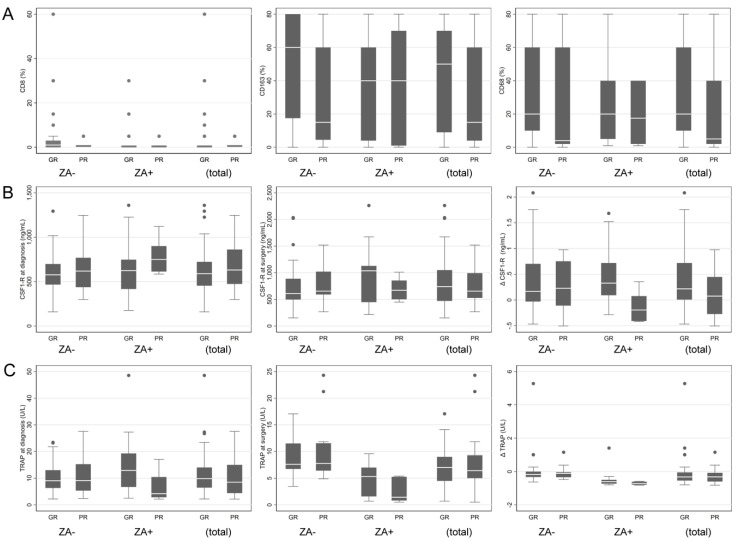
Figure 3.
Correlation of biomarkers with response to chemotherapy for patients who received (ZA+) or not (ZA−) zoledronic acid. (A) Representation of response to chemotherapy (GR: good responders; PR: poor responders) in relation to immunohistochemical analysis (% of cells positive) of CD8 (left panel), CD163 (middle panel) and CD68 (right panel). (B) Representation of response to chemotherapy (GR: good responders; PR: poor responders) in relation to serum analysis of CSFR-1 at diagnosis (left panel), surgery (middle panel) and the difference of CSF-1R levels between diagnosis and surgery (right panel). (C) Representation of response to chemotherapy (GR: good responders; PR: poor responders) in relation to serum analysis of TRAP at diagnosis (left panel), surgery (middle panel) and the difference of TRAP levels between diagnosis and surgery (right panel).

