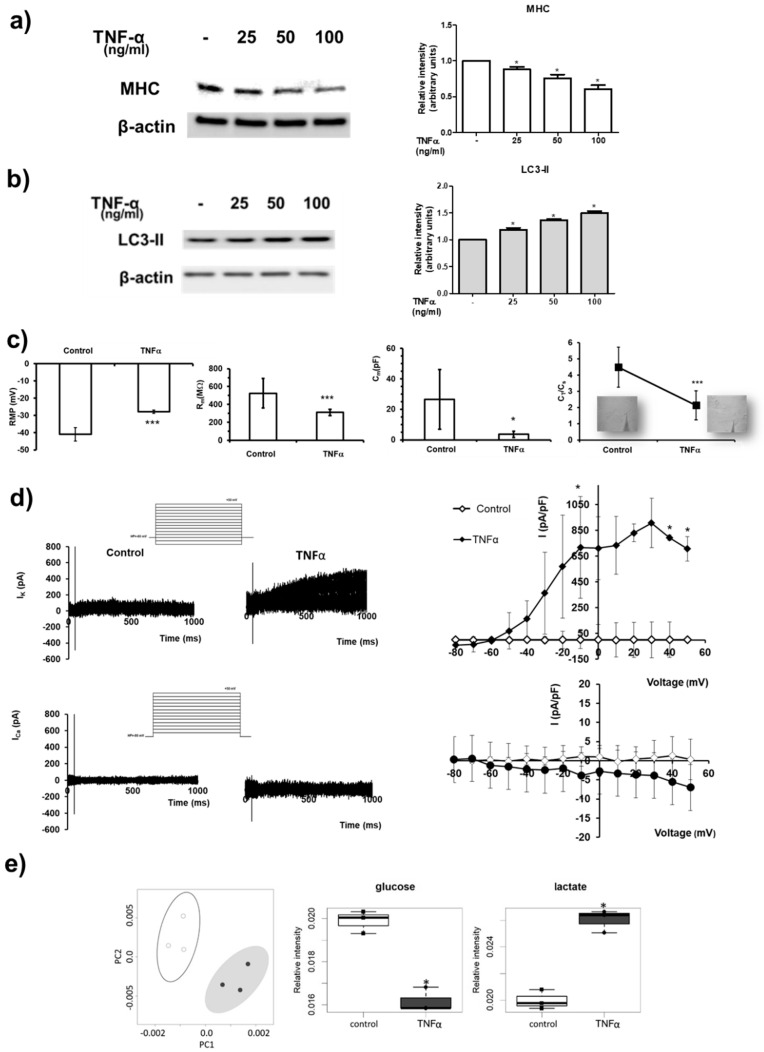
Figure 1.
TNFα-induced atrophy in C2C12 myotubes. (a,b) C2C12 myotubes were treated with TNFα at the indicated concentrations (25–100 ng/mL) for 24 h. Western blot analysis was performed using specific anti-MHC (a) and anti-LC3 (b) antibodies in cell lysates. Left panels: blot representative of at least three independent experiments with analogous results is shown. Right panels: densitometric analysis of at least three independent experiments. Data are the mean ± SEM and are reported as protein expression normalized to β-actin, -fold change over control (set as 1). TNFα decreases the expression of MHC in a statistically significant manner by one-way ANOVA followed by Bonferroni’s post hoc test (* p < 0.05, treated vs. control). TNFα increases LC3-II in a statistically significant manner by one-way ANOVA followed by Bonferroni’s post hoc test (* p < 0.05, treated vs. control). (c) Resting membrane potential (RMP) evaluated in current-clamp mode, membrane resistance (Rm) and membrane capacitance (Cm ) estimated in voltage-clamp and CT/Cs ratio in the different conditions. All of the results and number of cells investigated are listed in Table S1 as mean ± SD. * indicates p < 0.05 and *** p < 0.001 vs. control (unpaired Student’s t test). (d) Upper panels: representative outward K+ currents (in pA) evoked in response to 1-s long pulse protocol ranging from −80 up to +50 mV (HP = −60 mV) in control myotubes and in TNFα-treated ones. Overall I–V plots related to all the experiments conducted in any conditions are reported. The current amplitude is measured for each voltage step at the end of the pulse. * p < 0.05 vs. control (unpaired Student’s t test), (n = 6 to 7 for the different treatments). Lower panels: typical inward Ca2+ currents (in pA) recorded using the solutions described in the Methods section in response to 1-s long pulse protocol from −80 up to +50 mV (HP = −80 mV) in control myotubes and in TNFα-treated ones. Overall I–V plots related to the amount of experiments conducted in any conditions show not statistically significant differences (p > 0.05 vs. control, unpaired Student’s t test), (n = 4 to 7, for the different treatments). Data are the mean ± SD. Error bars are shown when their size is bigger than the symbol. (e) Left panel: metabolomic phenotyping of conditioned media (exo-metabolome) of C2C12 myotubes treated or not with 100 ng/mL TNFα for 24 h. Score plots of PCA: PC1 vs. PC2. In the score plots, each dot represents a different sample, and each colour represents a different group of samples—white: control; dark grey: TNFα. Right panels: boxplot of the metabolites involved in glycolysis. Changes in metabolite levels caused by TNFα were statistically significant by paired Wilcoxon test, (* p < 0.05).

