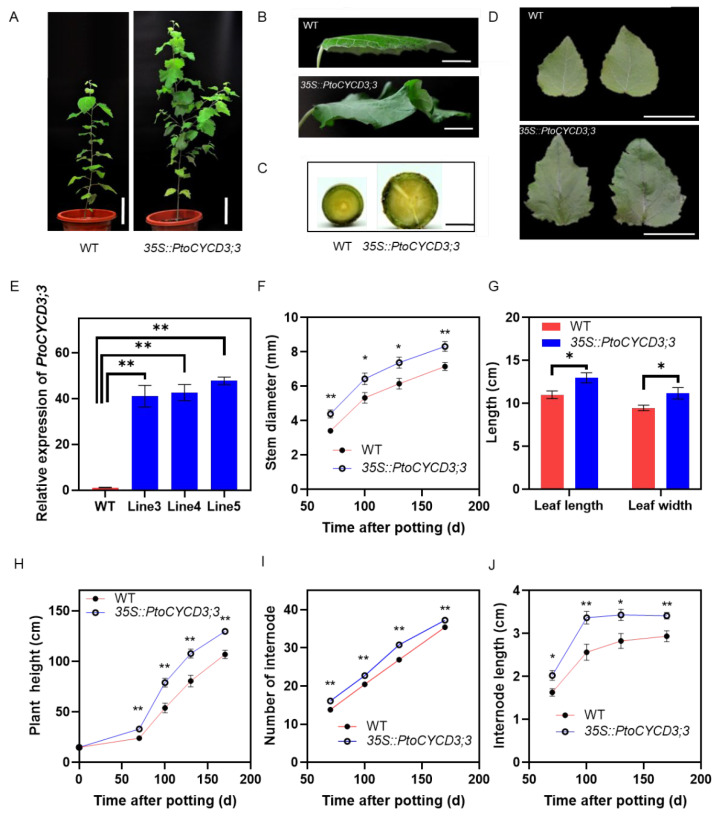
Figure 2.
Morphological phenotypes in the overexpression of PtoCYCD3;3 in Populus. (A) Whole plants. (B,D) Leaf of wild-type (WT) and 35S::PtoCYCD3;3 plants. (C) Stems. (E) Expression levels of PtoCYCD3;3 in wild-type (WT) plants and three independent lines of 35S::PtoCYCD3;3 plants. The expression in each sample was normalized using Populus Actin (GenBank number XM_002316253) as an internal control. The bars represent the mean SE of three biological replicates. (F) Stem diameter. (G) Leaf size. (H) Plant height. (I) Number of internodes. (J) Internode length. Significance as determined by independent sample T-test: * p < 0.05, ** p < 0.01. The values are means ±SE, n = 10. Ten transgenic lines were used to measure growth parameters. Each transgenic line used one individual. (A–C) The plant age was at 110 days. (D,E) The plant age was at 70 days. (G) The plant age was at 130 days. Bar, 15 cm (A); 2 cm (B); 0.5 cm (C); 3 cm (D).

