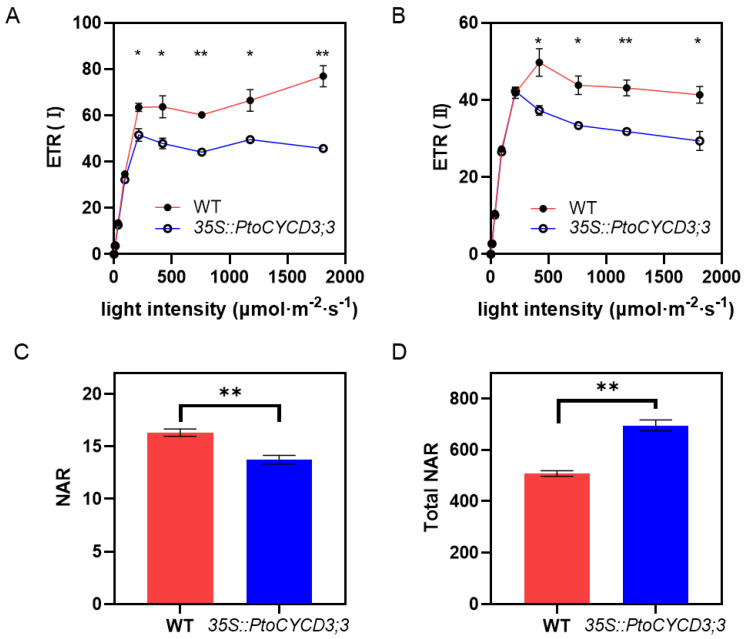
Figure 4.
Photosynthesis of wild-type and 35S::PtoCYCD3;3 plants. (A,B) Electron transfer rate of photosystems I and II under different light intensities. (C) Net assimilation rate per unit leaf area. (D) Net assimilation rate of total leaf area. Significance as determined by independent sample T-test: * p < 0.05, ** p < 0.01. The values are means ±SE, n = 3. Three transgenic lines were used.

