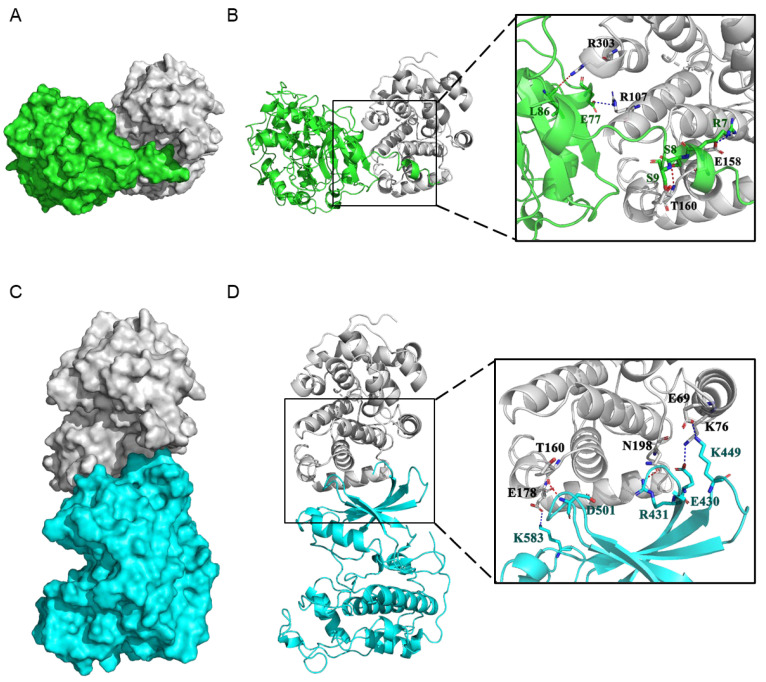
Figure 8.
Protein–protein docking of PtoCYCD3;3 with PtoCDKE;2 and PtoCDKG;3. (A) Surface binding model between PtoCDKE;2 and PtoCYCD3;3. The surface of PtoCDKE;2 is colored in green. The surface of PtoCYCD3;3 is colored in gray90. (B) Detail binding model between PtoCDKE;2 and PtoCYCD3;3. The backbone of PtoCDKE;2 is depicted as green cartoon. The residues in PtoCDKE;2 are colored in green. The backbone of PtoCYCD3;3 is depicted as gray90 cartoon. The residues in PtoCYCD3;3 are colored in gray90. The red dashes represent hydrogen bond interaction, and the blue dash represents salt bridge. (C) Surface binding model between PtoCDKG;3 and PtoCYCD3;3. The surface of PtoCDKG;3 is colored in cyan. The surface of PtoCYCD3;3 is colored in gray90. (D) Detail binding model between PtoCDKG;3 and PtoCYCD3;3. The backbone of PtoCDKG;3 is depicted as cyan cartoon. The residues in PtoCDKG;3 are colored in cyan. The backbone of PtoCYCD3;3 is depicted as gray90 cartoon. The residues in PtoCYCD3;3 are colored in gray90. The red dashes represent hydrogen bond interaction, and the blue dash represents salt bridge.

