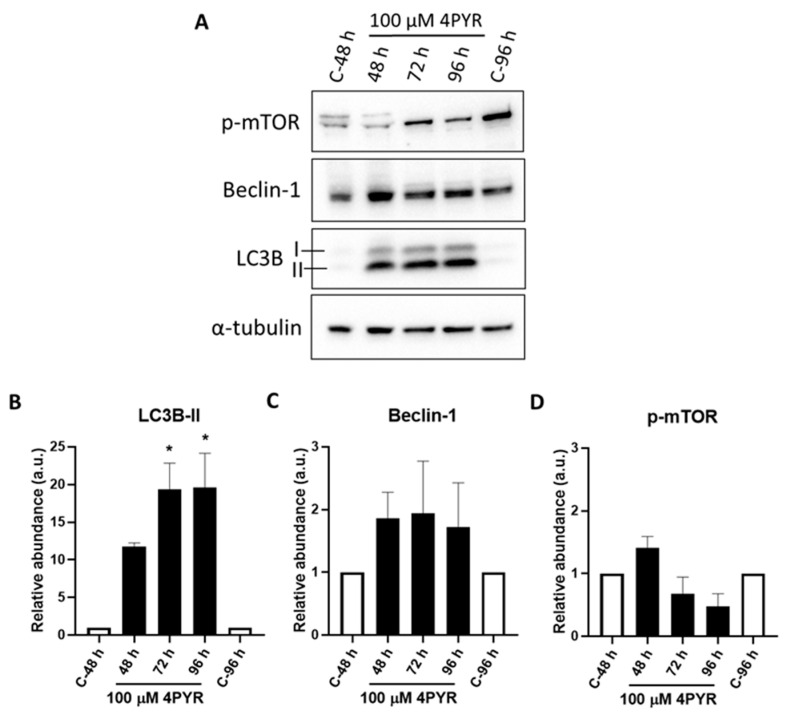
Figure 7.
4PYR induced autophagy in HepG3 cells. HepG3 cells were continuously dosed with 100 µM of 4PYR for 48, 72, and 96 h. (A) Increased protein expression levels of the autophagy marker LC3BII, Beclin-1, and decrease in phospho-mTOR were assessed using immunoblot in 4PYR treated HepG3 cells compared to vehicle-treated control cells. α-tubulin was used as a loading control for immunoblotting. The graph shows quantified protein expression levels relative to controls for (B) LC3B-II, (C) Beclin-1 and (D) phosphor-mTOR in HepG3 cells. Results are expressed as relative abundance (a.u.) ± SEM of two biological replicates. Statistical significance: * p < 0.05.

